
Main Points:
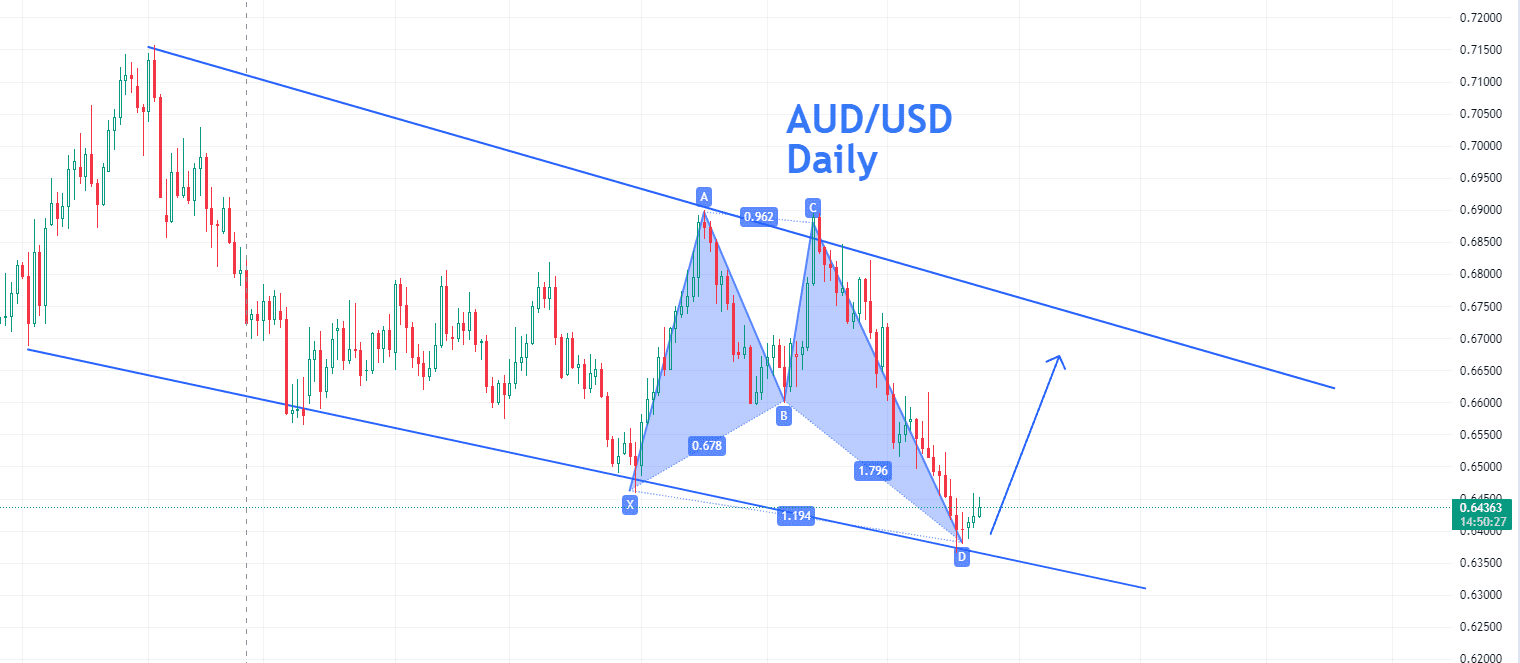
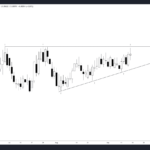
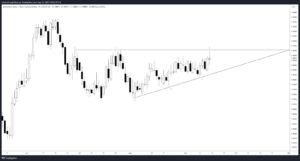
- The AUDUSD daily chart reveals a pronounced bearish shuffle.
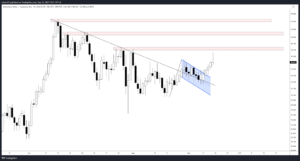
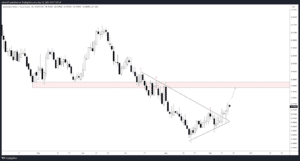
- It’s nestled within a significant support zone, harmonizing with a butterfly trading pattern.
- This confluence augments the anticipation of an upward reversal.
Current Technical Landscape
On delving into the daily dynamics of the AUDUSD, one can’t help but notice the prevailing bearish rhythm that seems to dictate its movement. However, not all appears gloomy for those with an astute analytical eye. The pair, in its current positioning, is hovering around a crucial support zone. Intriguingly, this isn’t a mere standalone observation. This support region is in sync with the harmonic butterfly trading pattern, a renowned figure in the realm of technical analysis known to prelude possible trend reversals.
Upcoming Economic Events & Potential Impact
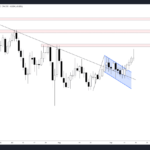
The harmony of such a potent pattern within a key support zone amidst bearish winds isn’t just serendipitous. Historically, such technical confluences have been the bedrock for sizable market shifts. But as we navigate this analytical landscape, we mustn’t overlook the external influences. The week ahead is punctuated with pivotal economic announcements, particularly from the USD side. Such events, dependent on the data’s gravitas, can either amplify the technical indicators or introduce temporary dissonance.
| Element | Description | Potential Impact on AUDUSD |
|---|---|---|
| Harmonic Butterfly Pattern | A revered technical motif hinting at trend shifts | Posits a bullish pivot from the present bearish grip |
| Support Zone | A critical price belt warding off further declines | Essential for weighing the bearish trend’s potency |
| Economic Announcements | Imminent USD-centric data releases | Hold the potential to intensify or disrupt the ongoing trend |
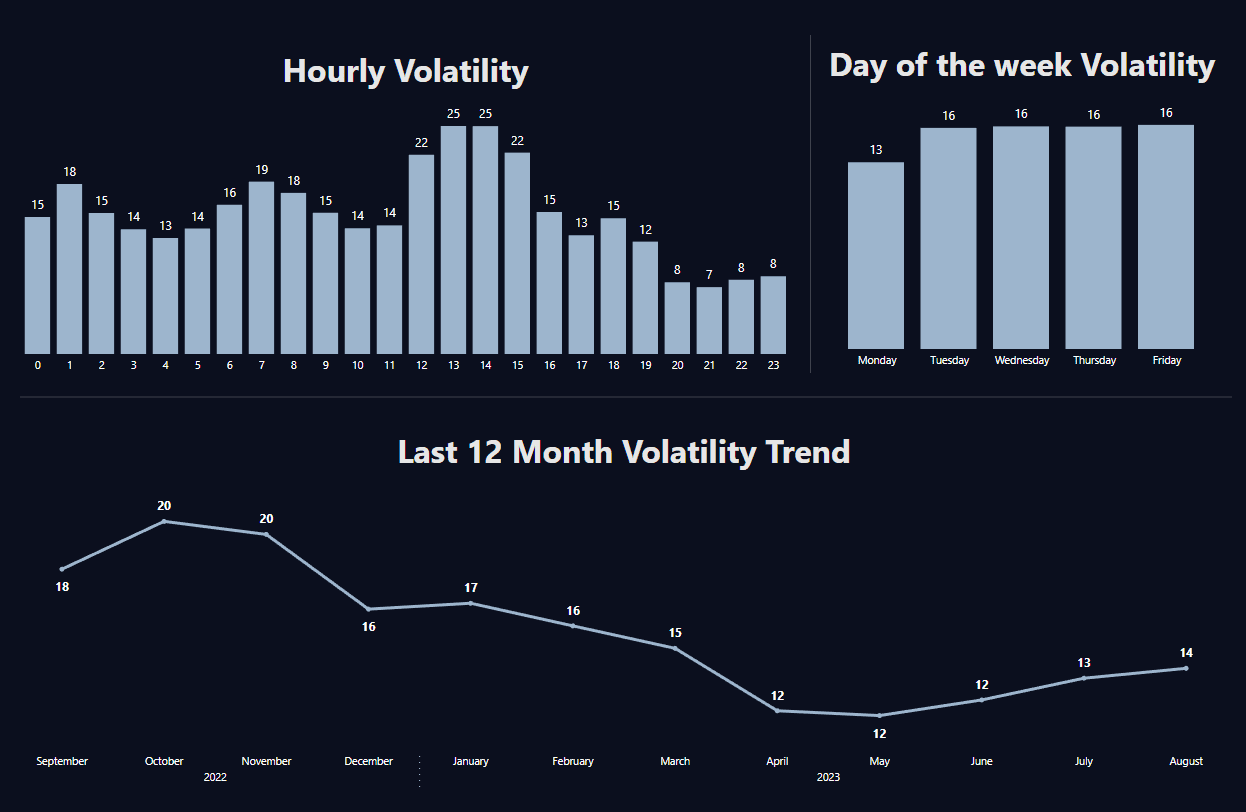
Unpacking Volatility Trends
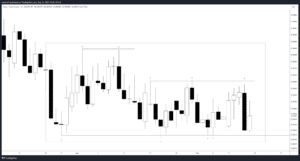
In the fast-paced world of forex, understanding volatility patterns can be a trader’s greatest ally. For those trading the AUDUSD pair on the daily timeframe, brace for some significant swings. AnalyticsTrade recent volatility analysis highlights the dynamism of this pair. While the week unfolds steadily, come Friday, the market’s tempo is set to rise, marking it as potentially the most turbulent day of the week. Moreover, daily traders should be on high alert between 12 PM and 3 PM UTC, a window that consistently witnesses increased fluctuations.
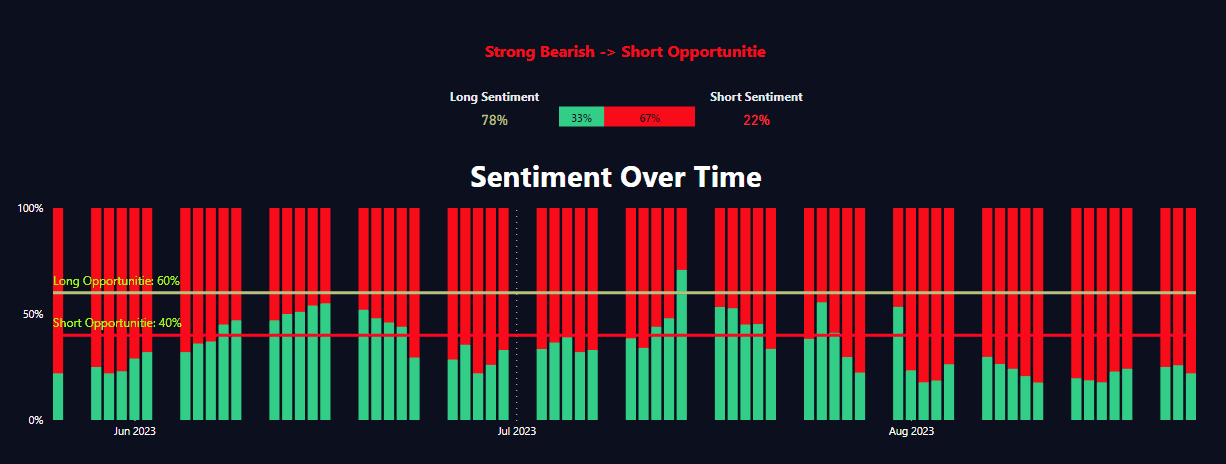
Dissecting Market Sentiment
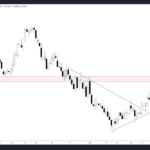
For traders eyeing the AUDUSD pair on the daily timeframe, the market presents a bit of a puzzle. While there’s no outright directional pull, a subtle but significant inclination is evident towards the sellers. This nuance hints at a possible continuation in the strength of the currency, aligning more with the sellers’ camp. Amidst this ambiguity, technical patterns, particularly the Butterfly trading pattern and Support and Resistance zones, become crucial indicators.
Concluding Remarks
In essence, the AUDUSD’s daily scene offers a tantalizing blend of technical insights and macroeconomic expectancy. For traders, it’s an opportune period to be vigilant, synthesizing both the chart’s cues and the upcoming economic narratives. The harmonic butterfly’s dance around a strategic support amidst bearish currents paves the way for what might be a riveting trading phase in the offing.
Comments