What is Technical Analysis of EUR/USD?
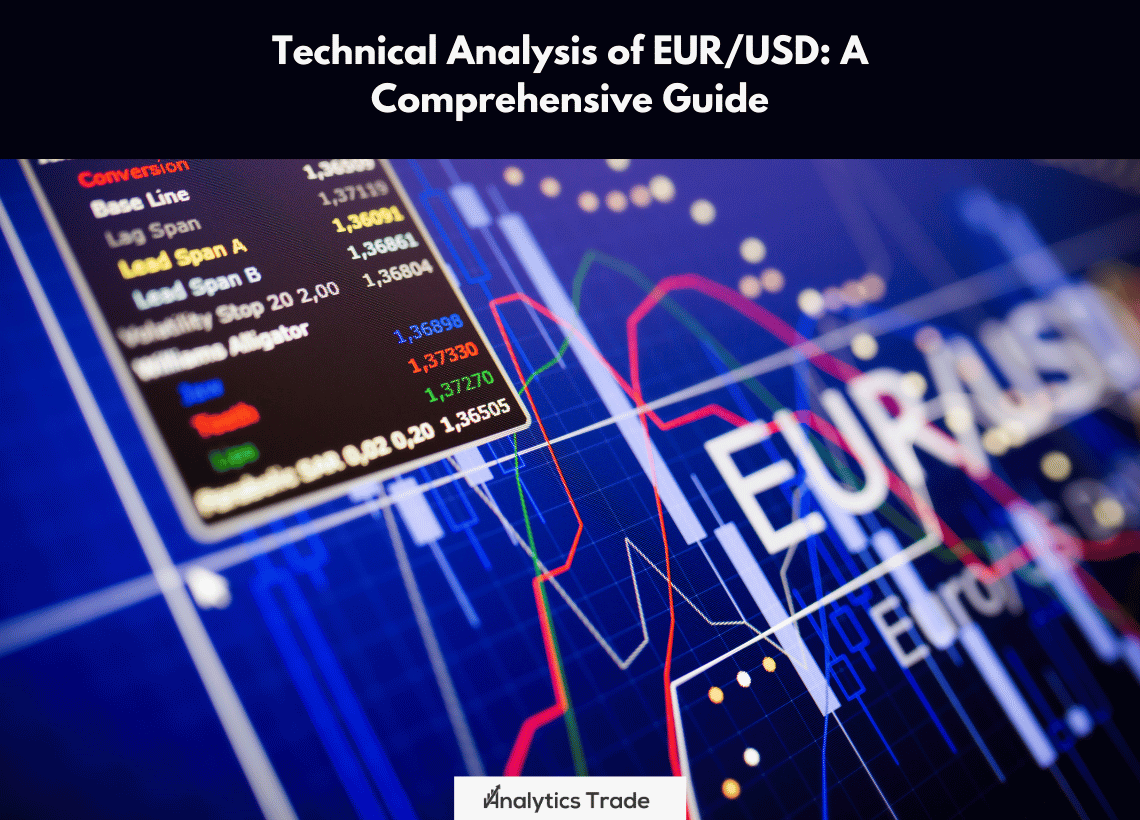
Technical analysis charting of EUR/USD is the study of the price movements of the currency pair in order to identify potential trading opportunities. Technical analysis is based on the assumption that prices move in trends, and that these trends can be identified and used to make profitable trades. Technical analysis of EUR/USD involves the use of various indicators, strategies, and tools to analyze the price movements of the currency pair.
Indicators Used in Technical Analysis of EUR/USD
There are a variety of indicators used in technical analysis of EUR/USD. These indicators include moving averages, oscillators, Fibonacci retracements, and other technical indicators. Moving averages are used to identify the trend of the currency pair, while oscillators are used to identify potential overbought and oversold conditions. Fibonacci retracements are used to identify potential support and resistance levels. Other technical indicators, such as Bollinger Bands and MACD, are also used to identify potential trading opportunities.
Moving Averages
Moving averages are one of the most commonly used indicators in technical analysis of EUR/USD. Moving averages are used to identify the trend of the currency pair. A simple moving average (SMA) is calculated by taking the average of the closing prices over a certain period of time. A longer-term SMA is used to identify the overall trend of the currency pair, while a shorter-term SMA is used to identify short-term trends.
Oscillators
Oscillators are another type of indicator used in technical analysis of EUR/USD. Oscillators are used to identify potential overbought and oversold conditions. The most commonly used oscillator is the Relative Strength Index (RSI). The RSI is calculated by taking the ratio of the average gains over a certain period of time to the average losses over the same period of time. If the RSI is above 70, it is considered overbought, and if it is below 30, it is considered oversold.
Strategies Used in Technical Analysis of EUR/USD
In addition to indicators, there are a variety of strategies used in technical analysis of EUR/USD. These strategies include trend following, range trading, and breakout trading. Trend following strategies involve entering trades in the direction of the trend. Range trading strategies involve entering trades when the price reaches a certain level. Breakout trading strategies involve entering trades when the price breaks out of a range.
Tools Used in Technical Analysis of EUR/USD
In addition to indicators and strategies, there are a variety of tools used in metatrader4.com/en”target=”_blank” rel=”noopener” >metatrader-4-for-technical-analysis/”target=”_blank” rel=”noopener” >technical analysis charting of EUR/USD. These tools include charting software, trading platforms, and economic calendars. Charting software is used to create charts of the currency pair and to identify potential trading opportunities. Trading platforms are used to execute trades and manage positions. Economic calendars are used to keep track of economic events that may affect the price of the currency pair.
Answers and Questions
What is Technical Analysis of EUR/USD?
Technical analysis of EUR/USD is the study of the price movements of the currency pair in order to identify potential trading opportunities.
What indicators are used in technical analysis of EUR/USD?
The most commonly used indicators in technical analysis of EUR/USD are moving averages, oscillators, Fibonacci retracements, and other technical indicators.
What strategies are used in technical analysis of EUR/USD?
The most commonly used strategies in technical analysis of EUR/USD are trend following, range trading, and breakout trading.
What tools are used in technical analysis of EUR/USD?
The most commonly used tools in technical analysis of EUR/USD are charting software, trading platforms, and economic calendars.
Personal Opinion
Technical analysis of EUR/USD is a powerful tool for traders looking to capitalize on the movements of the currency pair. By using indicators, strategies, and tools, traders can identify potential trading opportunities and execute trades with confidence. While technical analysis of EUR/USD can be a complex and time-consuming process, it can be a great way to gain an edge in the markets.


Comments