
What Are Technical Indicators?
Technical analysis indicators are mathematical calculations based on the price, volume, or open interest of a security or contract. They are used to forecast price movements and to provide traders with a better understanding of the market. Technical indicators are used by traders to identify potential trading opportunities and to make decisions about when to enter and exit trades.
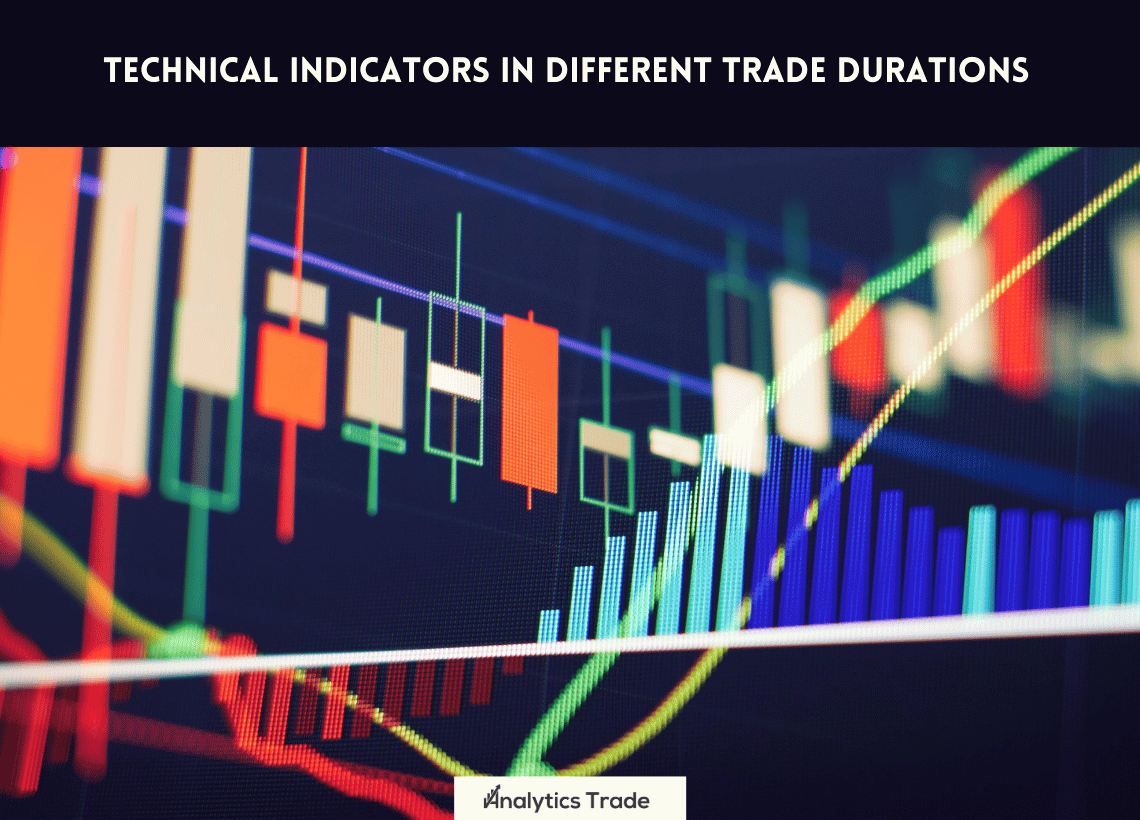
How Do Technical Indicators Help in Different Trade Durations?
Technical analysis indicators can be used to help traders identify potential trading opportunities in different trade durations. Short-term traders use technical analysis indicators to identify short-term trends and to identify potential entry and exit points. Long-term traders use technical indicators to identify long-term trends and to identify potential entry and exit points. Technical indicators can also be used to identify support and resistance levels. Support and resistance levels are areas where the price of a security or contract is likely to find support or resistance. Support levels are areas where the price of a security or contract is likely to find support and resistance levels are areas where the price of a security or contract is likely to find resistance. Technical analysis indicators can also be used to identify overbought and oversold conditions. Overbought conditions occur when the price of a security or contract is trading at a level that is higher than its average price over a certain period of time. Oversold conditions occur when the price of a security or contract is trading at a level that is lower than its average price over a certain period of time.
Moving Average Convergence Divergence (MACD)
The Moving Average Convergence Divergence (MACD) is a technical indicator that is used to identify potential trading opportunities in different trade durations. The MACD is calculated by subtracting the 26-day exponential moving average (EMA) from the 12-day EMA. The MACD line is then plotted against a signal line, which is a 9-day EMA of the MACD line. The MACD is used to identify potential trading opportunities in different trade durations. When the MACD line crosses above the signal line, it is a bullish signal and indicates that the price of a security or contract is likely to increase. When the MACD line crosses below the signal line, it is a bearish signal and indicates that the price of a security or contract is likely to decrease.
Relative Strength Index (RSI)
The Relative Strength Index (RSI) is a technical indicator that is used to identify potential trading opportunities in different trade durations. The RSI is calculated by taking the average of the gains over a certain period of time and dividing it by the average of the losses over the same period of time. The RSI is then plotted on a scale of 0 to 100. The RSI is used to identify potential trading opportunities in different trade durations. When the RSI is above 70, it is considered to be overbought and indicates that the price of a security or contract is likely to decrease. When the RSI is below 30, it is considered to be oversold and indicates that the price of a security or contract is likely to increase.
Bollinger Bands
Bollinger Bands are a technical indicator that is used to identify potential trading opportunities in different trade durations. Bollinger Bands are calculated by taking the moving average of a security or contract and adding and subtracting two standard deviations from the moving average. The upper band is the moving average plus two standard deviations and the lower band is the moving average minus two standard deviations. Bollinger Bands are used to identify potential trading opportunities in different trade durations. When the price of a security or contract is trading above the upper band, it is considered to be overbought and indicates that the price of a security or contract is likely to decrease. When the price of a security or contract is trading below the lower band, it is considered to be oversold and indicates that the price of a security or contract is likely to increase.
Conclusion
Technical indicators can be used to help traders identify potential trading opportunities in different trade durations. Technical indicators such as the Moving Average Convergence Divergence (MACD), the Relative Strength Index (RSI), and Bollinger Bands can be used to identify potential trading opportunities and to identify support and resistance levels. Technical indicators can also be used to identify overbought and oversold conditions.
Personal Opinion
Technical indicators are a great tool for traders to use in different trade durations. They can help traders identify potential trading opportunities and to identify support and resistance levels. They can also be used to identify overbought and oversold conditions. Technical indicators can be used in combination with other analysis techniques to maximize profits and minimize losses.


Comments