What are Bollinger Bands?
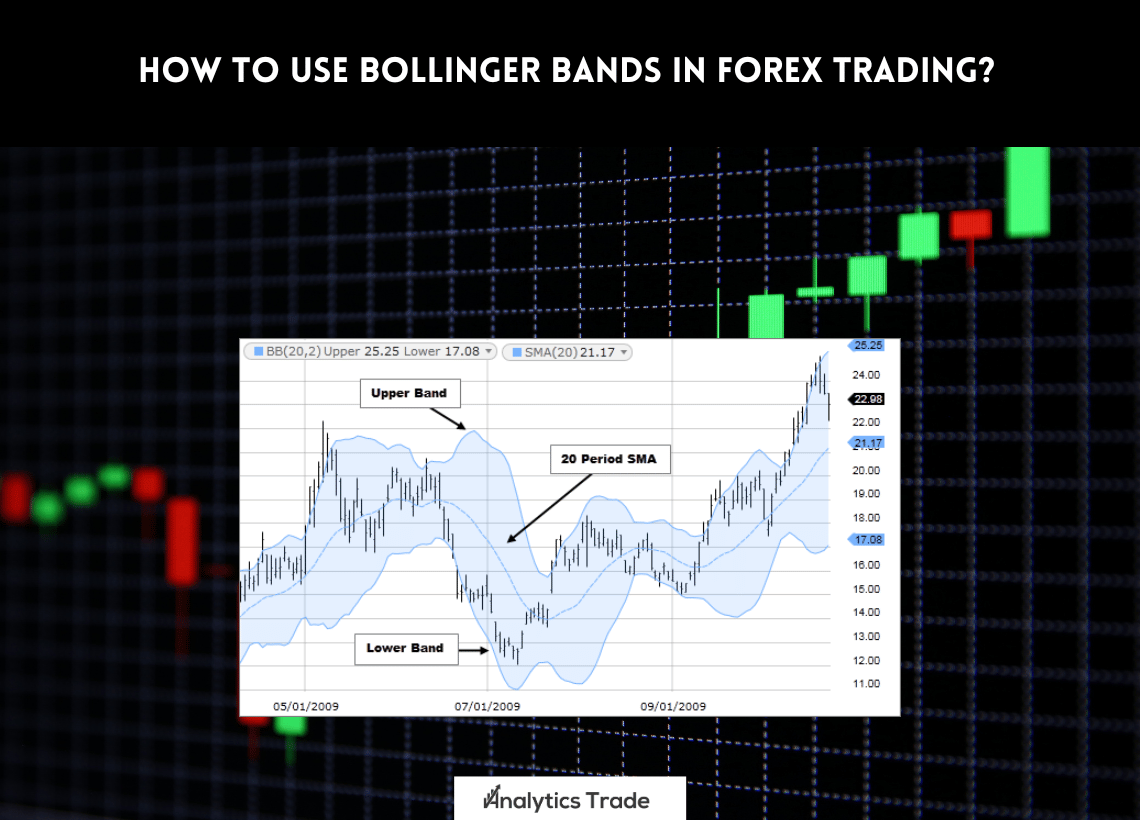
Bollinger Bands are a technical analysis tool developed by John Bollinger in the 1980s. They are a type of trading indicator used to measure market volatility. Bollinger Bands consist of a set of three bands drawn in relation to price: an upper, middle and lower band. The middle band is a simple moving average (SMA) of the security’s price, while the upper and lower bands are typically two standard deviations away from the SMA.
How to Use Bollinger Bands in Forex Trading
Bollinger Bands can be used to identify potential trading opportunities in the Forex market. Traders can use the bands to determine overbought and oversold levels, as well as to spot potential breakouts.
Identifying Overbought and Oversold Levels
When the price of a security moves outside of the upper or lower Bollinger Bands, it is said to be overbought or oversold. This can be used as an indication that the price may soon return to the mean.
Spotting Potential Breakouts
When the price of a security moves within the upper and lower bands, it is said to be consolidating. This can be used as an indication that the price may soon break out of the range.
Calculating Bollinger Bands
Bollinger Bands are calculated using the following formula:Upper Band = SMA + (2 x Standard Deviation)Lower Band = SMA – (2 x Standard Deviation)Where SMA is the simple moving average of the security’s price and Standard Deviation is a measure of volatility.
Reading the Graphical Signals
Bollinger Bands generate a variety of graphical signals that can be used to identify potential trading opportunities. These signals include:
- Squeezes – When the bands come close together, it is said to be a squeeze. This can be used as an indication that the price may soon break out of the range.
- Widening – When the bands move further apart, it is said to be a widening. This can be used as an indication that the price may soon return to the mean.
- Crossovers – When the price crosses the upper or lower band, it is said to be a crossover. This can be used as an indication that the price may soon reverse direction.
Conclusion
Bollinger Bands are a popular trading indicator used to gauge market volatility. They can be used to identify potential trading opportunities in the Forex market, such as overbought and oversold levels, as well as potential breakouts. They are calculated using the simple moving average of the security’s price and a measure of volatility. Bollinger Bands generate a variety of graphical signals that can be used to identify potential trading opportunities. For more information on how to use Bollinger Bands in Forex trading, you can visit Wikipedia.org or watch this video from Investopedia.


Comments