
Key Points:
- USD/JPY initially experiences minor bearish pressure but rebounds.
- Support stems from positive US data and a hawkish Federal Reserve (Fed) stance.
- Bank of Japan (BoJ) maintains a dovish stance.
- Focus on upcoming Fed rate decision.
The USD/JPY currency pair embarked on the week with a brief spell of bearish sentiment, which was swiftly counteracted as prices surged to attain recent swing highs. This analysis outlines the factors driving the pair’s performance and offers insights into potential future movements.
Positive US Data and Hawkish Fed Stance:
One of the primary drivers behind the USD/JPY pair’s performance is the confluence of favorable US economic data and a hawkish stance by the Federal Reserve. This combination of factors has provided substantial support to the pair. On the contrary, the Bank of Japan (BoJ) maintains a dovish stance, contributing to the divergence between the two central banks.
Technical Analysis:
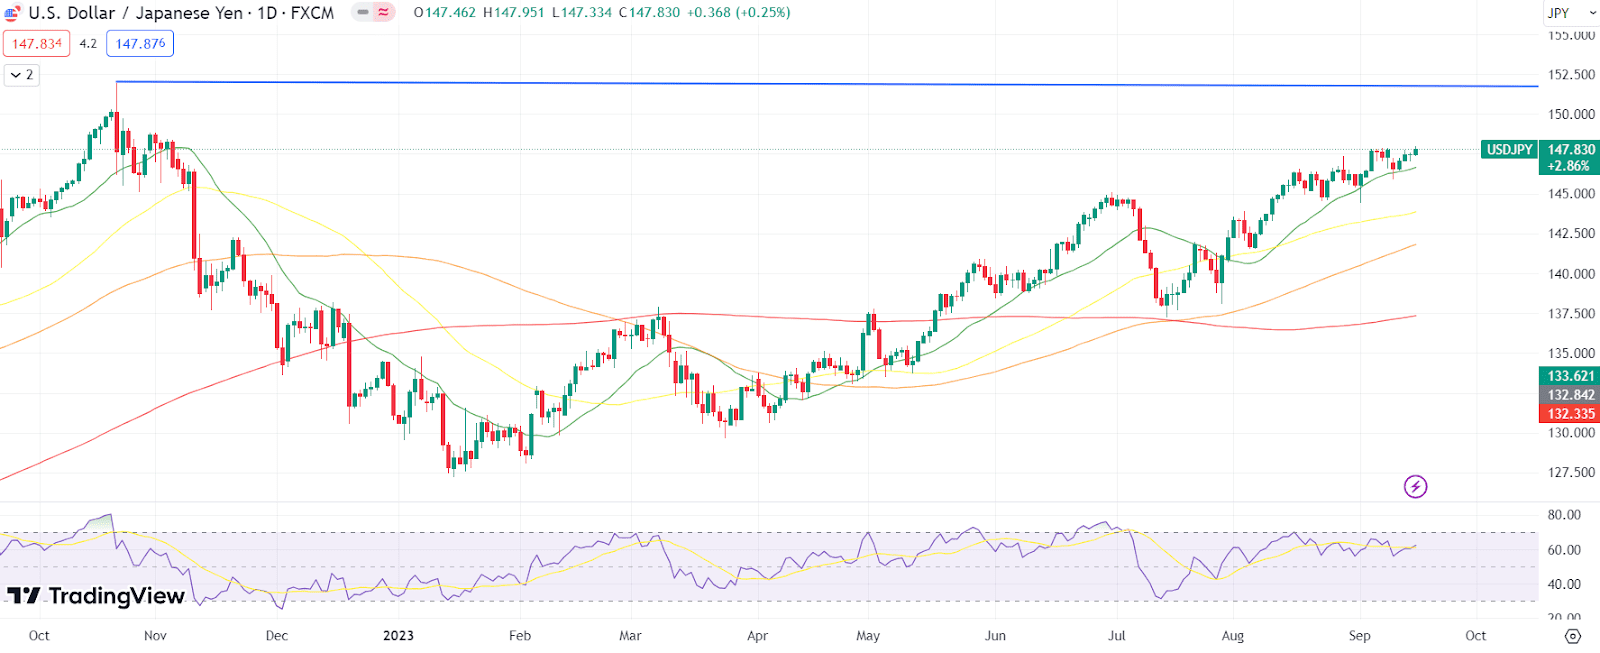
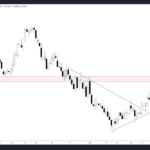
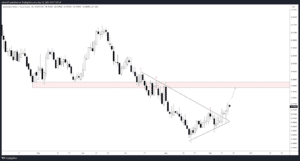
Turning our attention to the daily chart, we observe a noteworthy pattern. The key 20-day Simple Moving Average (SMA) has consistently acted as a safeguard for the pair since February 2023. This steadfast support suggests the pair’s resilience against bearish pressure. As such, the USD/JPY pair is poised to continue its bullish trajectory, with an ambitious target of revisiting the previous year’s high at 151.95. Nonetheless, the immediate challenge lies in breaching the formidable 148.00 level.
Comparison Table:
| Indicator | Value |
|---|---|
| Market Volatility | Moderate to High |
| Market Sentiment | Bullish |
| Technical Indicators | Strong Buy |
| Fundamental Analysis | Neutral |
| Swing Trading | Strong Buy |
| Trading Tools | Fibonacci |
This table offers a succinct assessment of vital market components, enabling traders to make informed decisions.
In summary, the USD/JPY currency pair initiates the week with a brief bearish phase but is swiftly recuperating. Support arises from positive US data and a hawkish Fed, while the BoJ maintains a dovish stance. The key 20-day SMA on the daily chart underscores the pair’s resilience, setting the stage for a potential push towards the previous year’s high at 151.95. Nevertheless, breaking the 148.00 level remains a formidable challenge.
Note: This technical analysis relies on historical price data, and actual market conditions may vary. Traders are advised to utilize additional information and conduct thorough research.
Comments