
The Greenback’s Journey: Aiming for New Heights
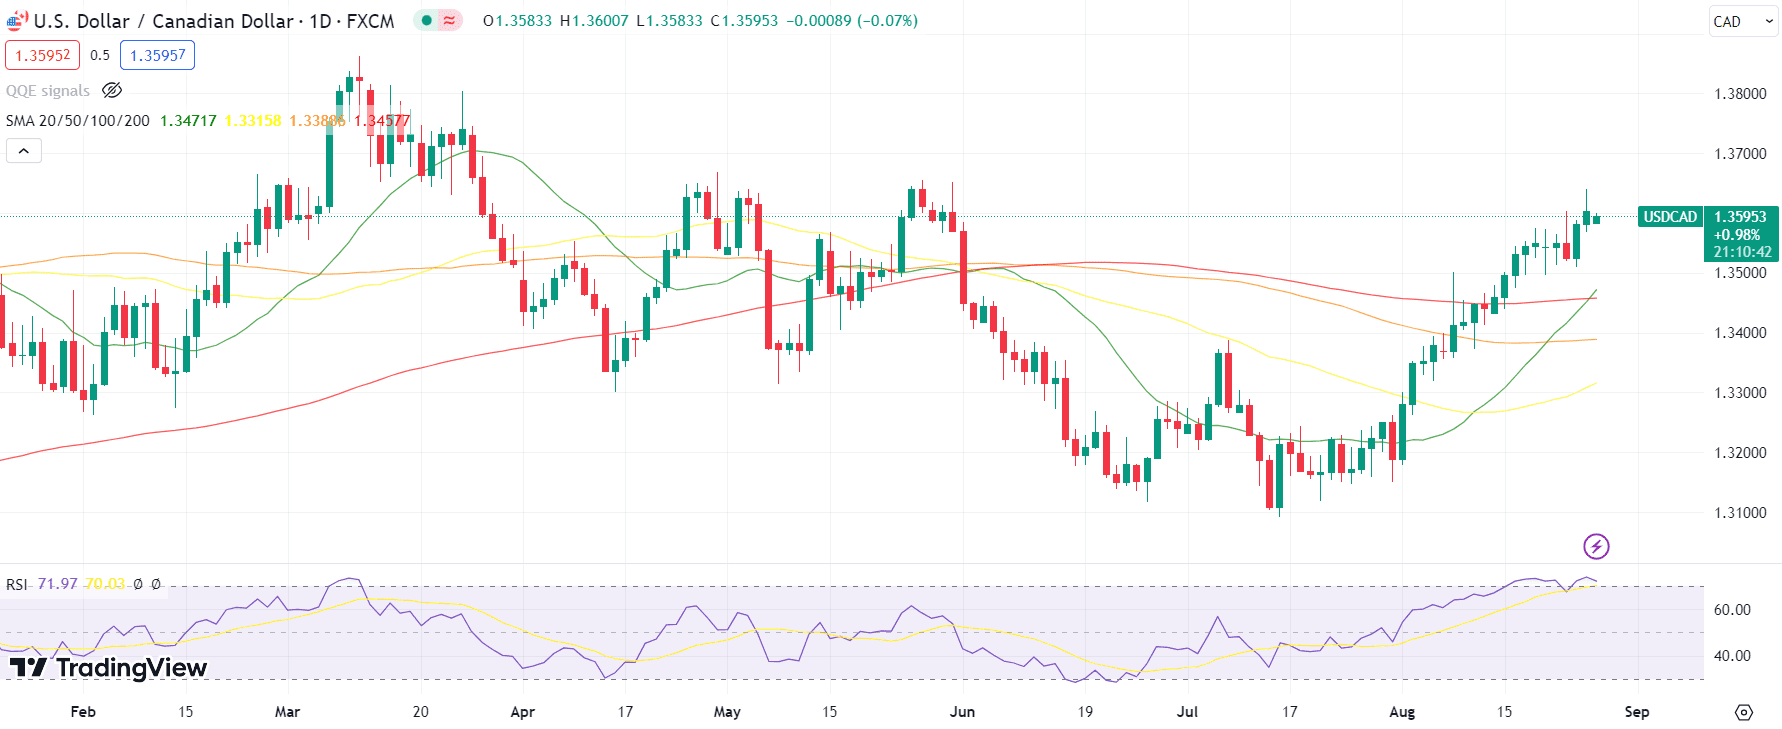
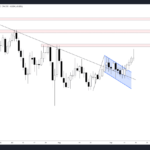
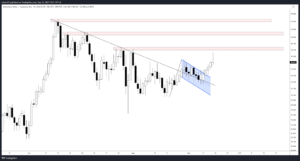
For anyone closely observing the USDCAD on a daily timeframe, this week has been an exciting ride. The US dollar flexed its muscles, demonstrating dominance against its Canadian counterpart. Currently, the pair is setting its sights on the promising 1.38 level, leaving traders and analysts alike in suspense. Yet, every ascent comes with its challenges. The possibility of a downward adjustment looms in the backdrop.
Main Points:
- USDCAD’s valiant effort to breach the 1.38 mark.
- Emerging signs of overbought conditions.
- Critical support level stationed at 1.34.
On the Brink of Overbought Territory
The daily visualizations for the USDCAD depict a riveting tale. While its recent strides have been commendable, certain indicators suggest caution. Specifically, the long shadow trailing Friday’s candle alludes to a hesitation in the market, signaling a potential retreat. Reinforcing this narrative is the RSI, which corroborates that the USDCAD is treading into overbought conditions. While this is not a definitive sign of an imminent reversal, it does emphasize the need for vigilance in anticipating potential market adjustments.
Guarding the Battlegrounds: Key Support Levels
Every currency pair finds its safety nets, and for the USDCAD, the 1.34 mark stands strong as the first line of defense. A descent below this territory would mean waving goodbye to the recent bullish aspirations, ushering in a bearish move. However, the road downward has further checkpoints. The 1.32 and subsequently, the 1.30 levels, aligned with the 50-day and 200-day moving averages, respectively, would act as robust pillars of support. These moving averages are not just arbitrary lines; they serve as critical trend navigators, ensuring that the pair doesn’t lose its way.
Comparison Table:
| Indicator/Level | Description |
|---|---|
| USDCAD Current Level | Close to 1.38 |
| Overbought Conditions | RSI indicating overbought territory |
| Immediate Support | 1.34 |
| Subsequent Supports | 1.32 (50-day MA), 1.30 (200-day MA) |
Analysis of Sentiment Data

Over the course of the last few days, we’ve observed a shifting sentiment landscape for the USDCAD pair. Notably, there is a prominent skew towards the short side on the 27th of August with a massive 0.96 (or 96%) of traders going short compared to a mere 0.04 (or 4%) favoring the long side. Such an extreme imbalance in sentiment often suggests a contrarian view, hinting at potential upcoming bullish activity. Earlier in the month, we’ve seen more balanced sentiments. However, on the 30th of July, an intriguing anomaly presents itself where a dominant 0.71 (or 71%) of traders held a long position against 0.29 (or 29%) on the short side.
Volatility Trends and Insights
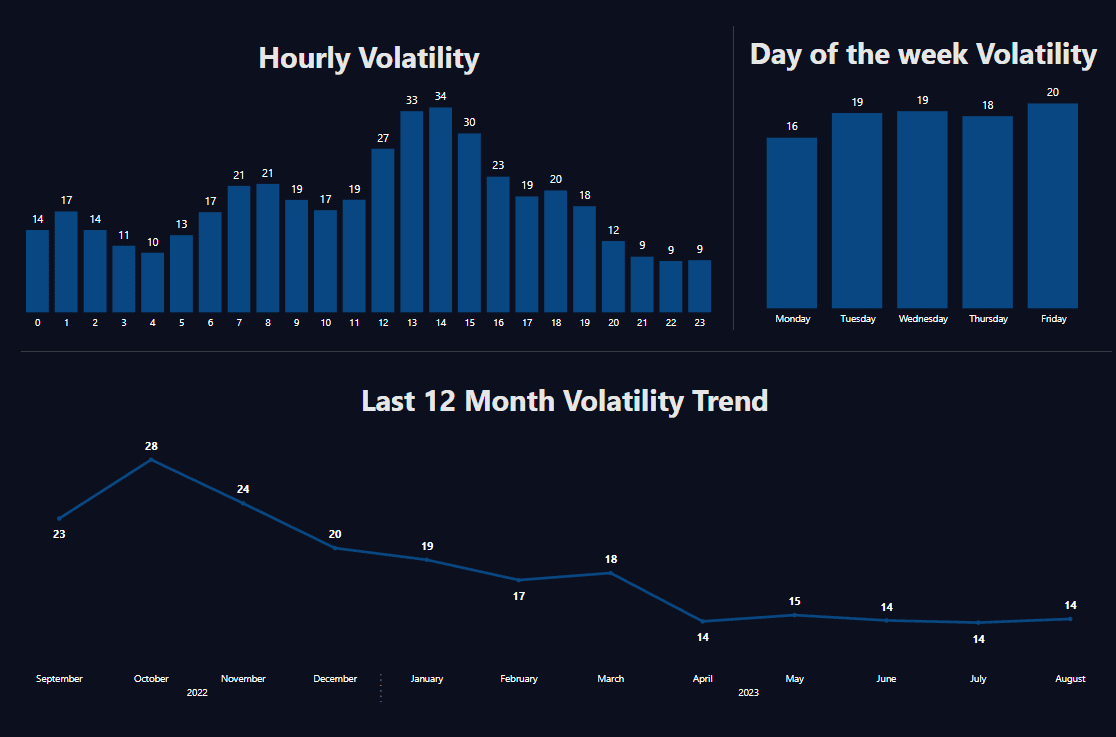
Throughout the period in consideration, USDCAD exhibited a diverse range of volatility. Starting from 30th July, we noted a decrease of 110.5 pips, a bearish signal that may have been propelled by the overwhelming long sentiment the same day. Fast forward to the end of July and the beginning of August, we witness a robust bullish momentum with an impressive rise of 115.6 pips on 31st July followed by another gain of 89.1 pips on 1st August. These bullish candles with a strong body percentage showcase a conviction in the upward move. Moving on to recent days, 23rd August stands out with an up move of 79.2 pips and a significant body percentage of 0.714651, indicating a strong bullish day. On the contrary, the 22nd of August experienced a decline of 83.6 pips, signaling bearishness. Of interest is the 21st of August, where the open and close prices were identical, leading to a “Doji” formation which often signifies indecision in the market.
Conclusion for This Week
In summation, the USDCAD pair showcased a blend of bullish and bearish volatility in the past month, complemented by varying trader sentiments. It’s crucial for traders to monitor these dynamics continually, considering both sentiment data and technical volatility indicators, to gauge potential future moves. As we’ve seen from the data, significant disparities in sentiment often precede contrary moves in the market, a phenomenon that seasoned traders might exploit. Going forward, vigilance and a holistic approach to analyzing both sentiment and volatility are recommended for effective trading decisions.
A Glimpse into the USDCAD’s Upcoming Week Economic Events
The USDCAD currency pair is poised for a week filled with vital economic indicators from the US. As traders prepare for potential volatility, a comprehensive understanding of these events can prove instrumental in formulating trading strategies.
Main Points:
- Focus on JOLTs Job Openings with high importance on 2023-08-29.
- Expectations around the S&P/Case-Shiller Home Price Indices.
- Dallas Fed Manufacturing Index reflecting the manufacturing pulse of the US.
Technical Insights
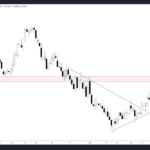
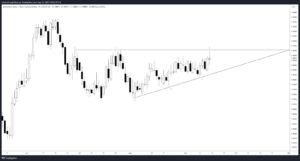
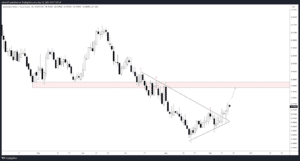
While economic indicators are vital tools in understanding the potential direction of the USDCAD, the technical analysis, when combined with this data, can offer a clearer picture. The currency pair has been showing signs of consolidation after last week’s rally, and the upcoming economic data might serve as the catalyst for the next big move. Levels of support and resistance will come into play, especially as traders react to the announced figures. Given the forecasted numbers, if they come out higher than expected, this might push the USDCAD to test key resistance levels. On the contrary, disappointing numbers might see the pair seek refuge at known support levels.
Week’s Economic Events:
| Date | Country | Indicator | Previous | Forecast | Currency | Importance |
|---|---|---|---|---|---|---|
| 2023-08-28 | US | Dallas Fed Manufacturing Index | -20.000 | -21.600 | USD | Medium |
| 2023-08-29 | US | JOLTs Job Openings | 9.582 | 9.465 | USD | High |
| 2023-08-29 | US | CB Consumer Confidence | 117.000 | 116.000 | USD | Medium |
| 2023-08-29 | US | API Crude Oil Stock Change | -2.418 | NaN | USD | Medium |
| 2023-08-29 | US | S&P/Case-Shiller Home Price MoM | 1.500 | 0.600 | USD | Medium |
| 2023-08-29 | US | S&P/Case-Shiller Home Price YoY | -1.700 | -1.300 | USD | Medium |
Conclusion for This Week
Traders focusing on the USDCAD pair should keep a keen eye on the upcoming economic indicators, especially the JOLTs Job Openings with its high importance. Combined with technical cues, these indicators will play a significant role in guiding the pair’s movement. Preparedness and timely reaction to the data can be the difference between capturing opportunities or missing them entirely.
In the realm of forex, predicting the USDCAD’s trajectory requires a balance of both analysis and intuition. As the greenback aspires for the 1.38 summit, the journey is fraught with both challenges and opportunities. But with knowledge, strategy, and a tad bit of luck, the highs and lows of this voyage can be navigated with finesse.
Comments