
Main Points:
- GBP/USD price faces downward pressure due to below-expected UK GDP.
- Strong US CPI and PPI data maintain support for the US dollar.
- Key events ahead include UK CPI, UK PMI, BoE rate decision, and FOMC.
- Utilize Technical Analysis and Trading Tools for market insights.
The GBP/USD currency pair experienced a decline, breaking below the 1.2400 level primarily due to disappointing UK GDP figures. Concurrently, robust US Consumer Price Index (CPI) and Producer Price Index (PPI) data sustained the strength of the US dollar. The upcoming week promises significant events such as UK CPI, UK PMI, the Bank of England (BoE) rate decision, and the Federal Open Market Committee (FOMC) meeting, all of which will influence directional bias.
Technical Analysis:
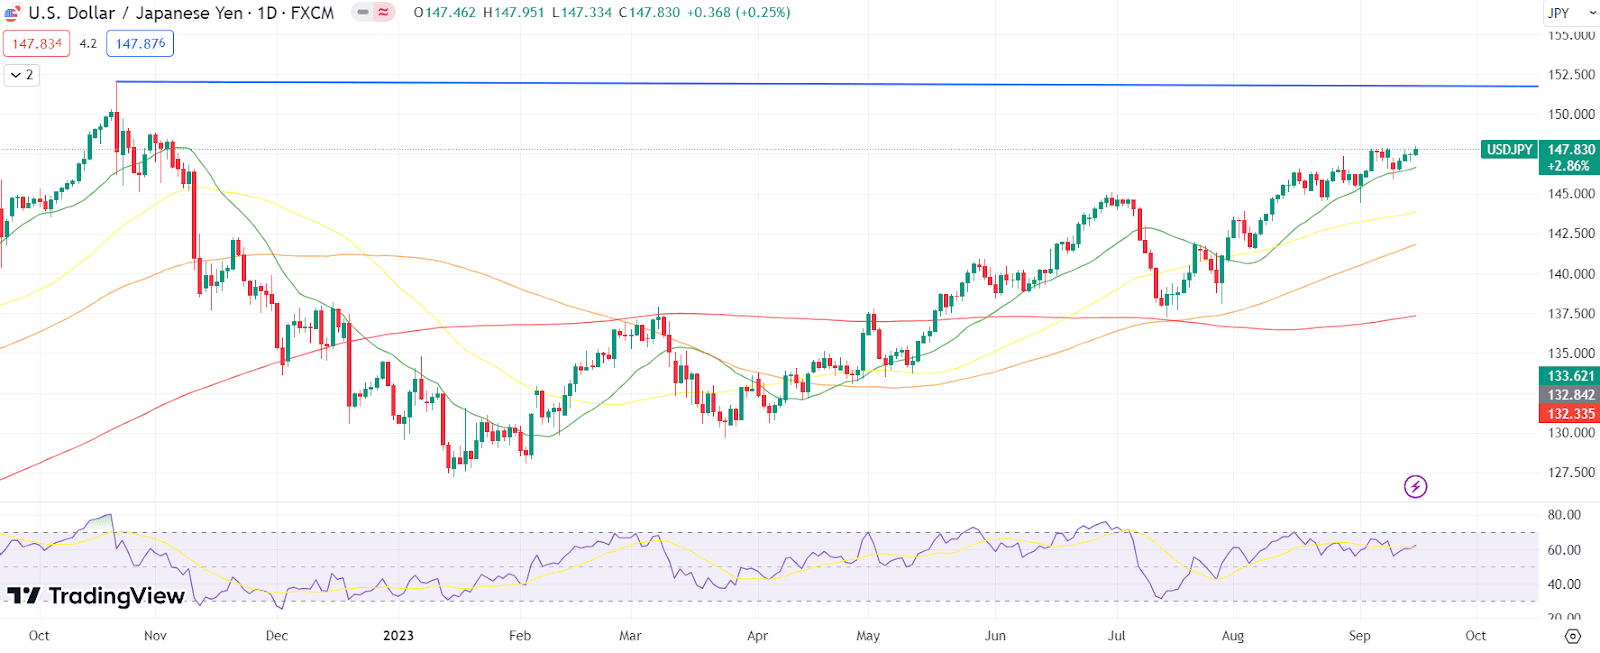
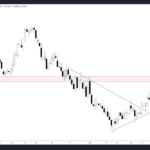
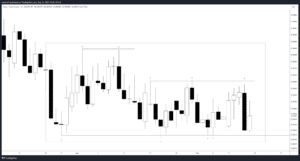
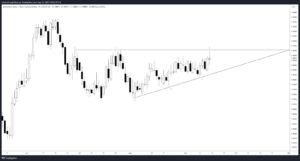
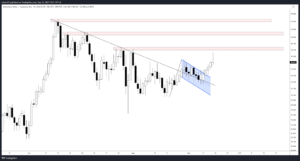
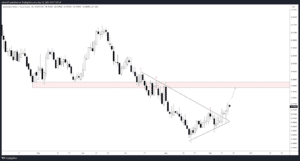
From a technical standpoint, the pair breached the 20-day support level, indicating a potential test of the 1.2309 support area. Conversely, a move back above the 200-day Simple Moving Average (SMA) could generate upward momentum, pushing the price toward the 20-SMA, located just below the 1.2600 region.
Comparison Table:
| Indicator | Value |
|---|---|
| Market Volatility | Moderate |
| Market Sentiment | Neutral |
| Technical Indicators | Bearish |
| Fundamental Analysis | Impactful |
The provided table offers a concise overview of essential market components, aiding traders in making informed decisions. Additionally, consider using Volatility Calculator and Sentiment Analysis tools for comprehensive insights.
In summary, the GBP/USD price experienced a decline driven by disappointing UK GDP data, while strong US CPI and PPI figures supported the US dollar. Upcoming events such as UK CPI, UK PMI, BoE rate decision, and FOMC will play a pivotal role in shaping market sentiment. From a technical perspective, the pair faces potential support at 1.2309 and resistance at the 200-day SMA near 1.2600.
Please note that this analysis relies on historical data, and market conditions may vary. Traders should supplement this information with thorough research and consider utilizing Trading Strategy and Trading Tools for effective decision-making.
Comments