
Main Points:
- GBP/USD Weekly Forecast rebounds from two-month low amid risk-off sentiment.
- Upcoming week lacks major UK and US data, emphasizing technical indicators.
- Caution urged due to low trading activity during holiday-shortened week.
Explore the GBP/USD Weekly Forecast as the Pound Sterling (GBP) makes a recovery against the United States Dollar (USD) from its recent two-month low. This analysis delves into the upcoming week, marked by holidays that limit new data from the UK and the US. Consequently, traders are advised to closely examine technical indicators to gauge potential movements in the GBP/USD currency pair. However, be cautious during this holiday-shortened week, as reduced trading activity may introduce greater unpredictability to the foreign exchange market.
Fundamentals: A Quiet Start to the Week
The week begins quietly with no trading in the US on Monday due to Labor Day, and no fresh data releases from the UK. The reduced trading activity may introduce greater unpredictability to the FX market. On Tuesday, attention turns to the final Services PMI from the UK and US Factory Orders. While these numbers may not strongly impact GBP/USD, the Caixin Services PMI from China during the Asian session could set the market tone for the day.
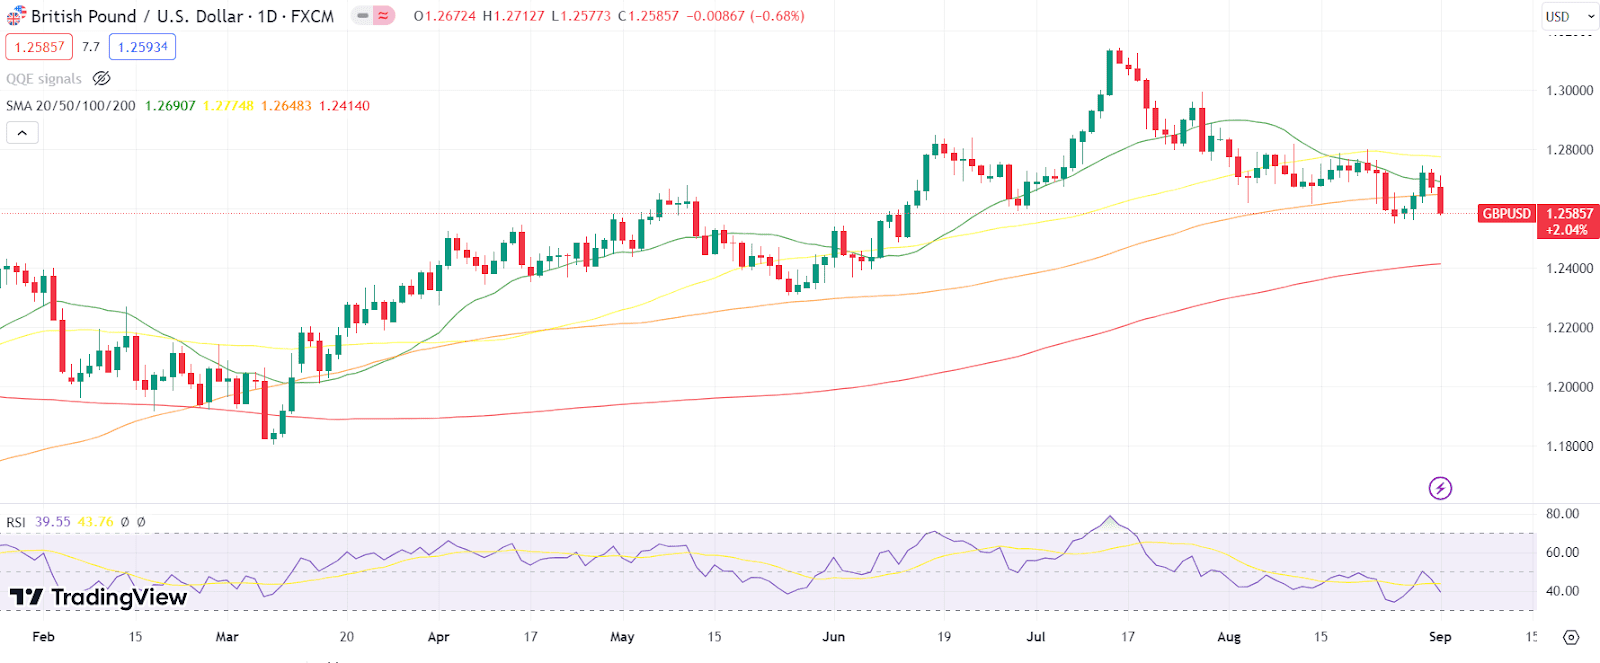
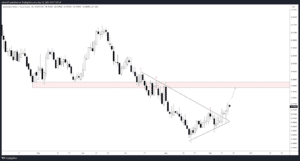
GBP/USD Technical Analysis and Support Levels
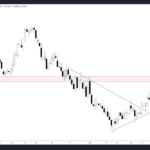
The GBP/USD price currently hovers near an interim support level. A breakdown below this level could lead to a potential move towards the 200-day Simple Moving Average (SMA) and the previous swing level, roughly around 1.2300-1.2390.
The 200-day Simple Moving Average: The Forex Lighthouse
Ever been on a highway, humming to your favorite tune, and watched the road markers guide your journey? That’s what the 200-day Simple Moving Average (SMA) does in the unpredictable terrain of forex trading!
Your Trusty SMA: More Than Just a Line
The 200-day SMA, a celebrated Moving Average, is the road marker many traders swear by. It serves as a crucial threshold, acting as resistance and support, indicating when the market might be changing direction. Yet, blending in Forex Sentiment Analysis can amplify its charm.
200-day SMA vs. Trader’s Emotion
| Indicator | Insight Offered |
|---|---|
| 200-day SMA | Reveals long-term price trends |
| Forex Sentiment Analysis | Provides a peek into traders’ emotions |
My Top 3 ‘Aha!’ SMA Moments
- Discovering a trend reversal during my sister’s wedding and making a cheeky trade between dances.
- Comparing SMA curves to roller-coaster rides during a theme park visit. Ups, downs, and thrilling turns!
- Explaining the SMA to my grandma, only to realize she’s a trend-watching genius in her knitting patterns.
Comparison Table: Key Indicators
| Indicator | Observation |
|---|---|
| Market Volatility | Moderate |
| Market Sentiment | Risk-off |
| Fundamental Analysis | Low Impact Data |
| Technical Indicators | Recovery Signals |
Utilizing Volatility Tools and Technical Analysis
Given the risk-off sentiment and the absence of major data, traders should consider utilizing volatility tools to navigate potential market fluctuations. Technical analysis will play a vital role in assessing GBP/USD’s trajectory. Stay informed and exercise caution during this holiday-shortened trading week.
Explore More Forex Articles
For comprehensive forex insights, strategies, and analysis, explore our collection of forex articles. Equip yourself with the knowledge to make informed trading decisions.
Your Burning Questions Answered
- Q: Can I solely depend on the 200-day SMA for my trading strategy?
A: It’s a robust tool but shines brightest with companions like Volatility Analysis. - Q: How do I know if the SMA signal is strong?
A: Check its interaction with price – crossing the SMA can be a big hint! - Q: Is the SMA magic?
A: Almost, but even magic needs a sprinkle of strategy and analysis.
Comments