
Main Points
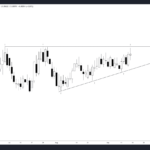
- The EUR/CAD currency pair on the daily timeframe is showing a bullish pattern, termed a “bull flag,” with the possibility of reaching 1.51 if it breaks current resistance.
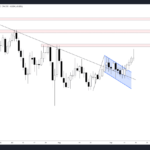
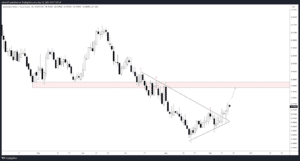
- If the currency pair fails to break the resistance level, a move down to 1.45 levels is plausible.
Market Sentiment and Technical Indicators: A Snapshot
Market sentiment seems to be leaning bullish as evidenced by a series of white candles (indicative of upward price movement) on the EUR/CAD daily chart. In the world of forex, understanding market sentiment is crucial to predict future trends. Moreover, technical indicators such as support and resistance levels add weight to this bullish sentiment.
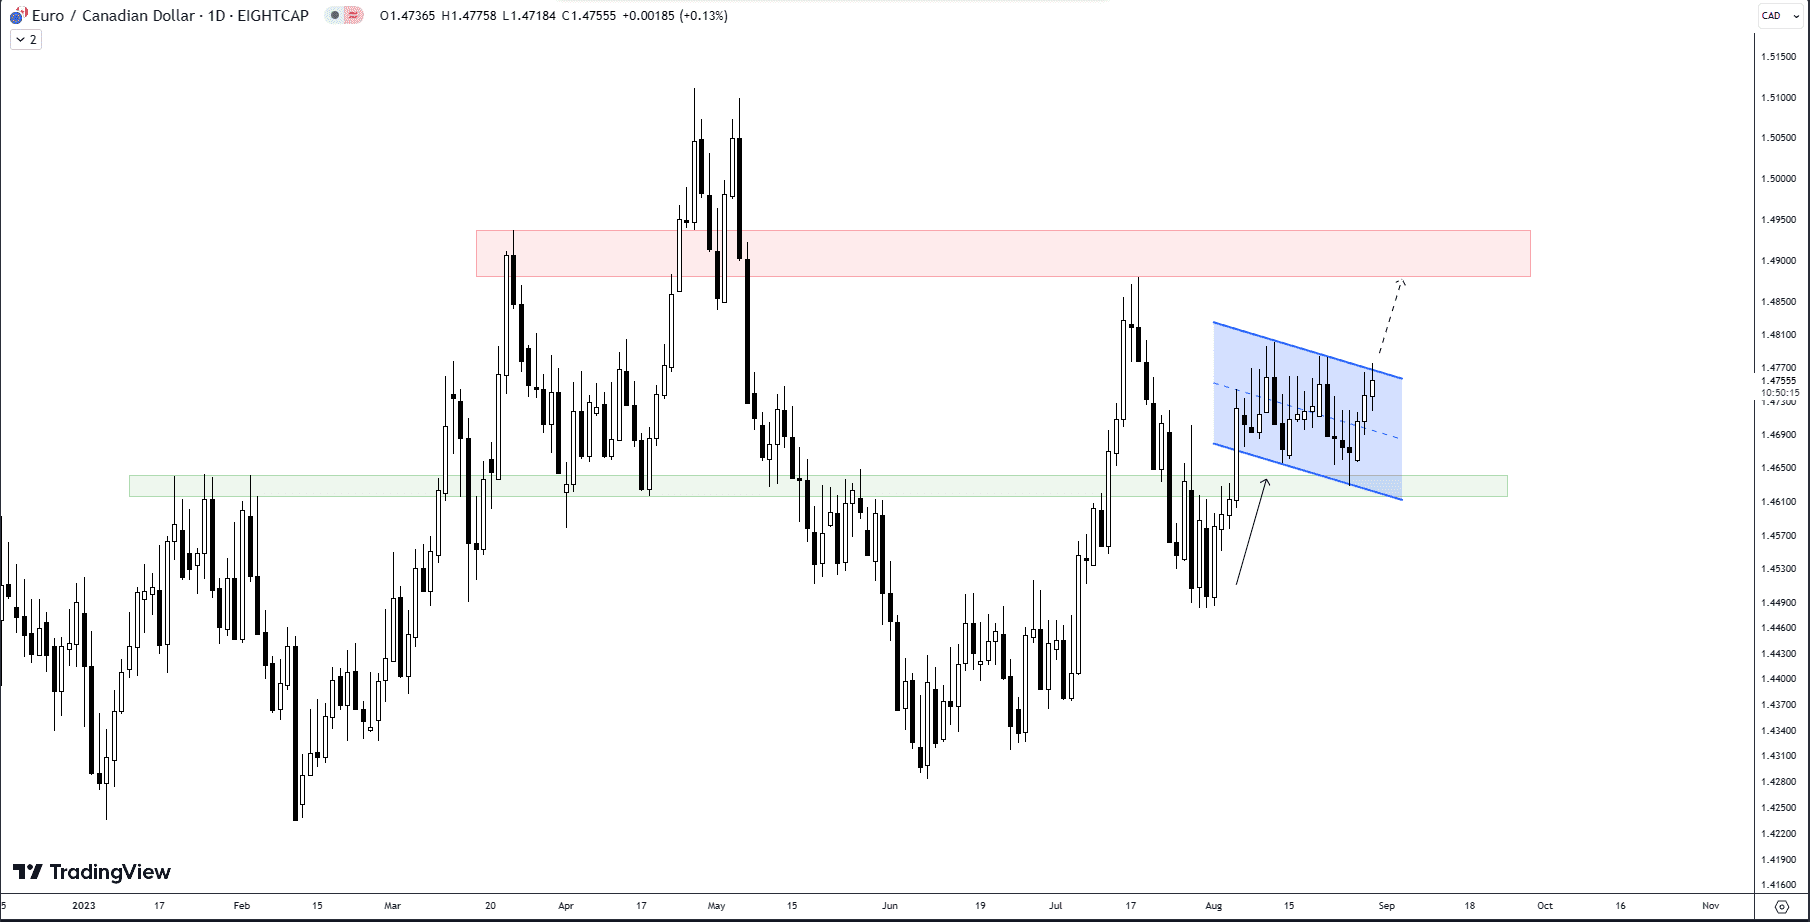
Inside the Bull Flag: A Detailed Look
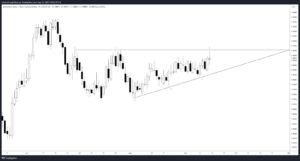
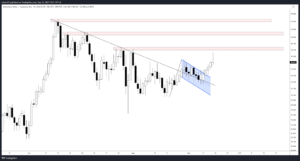
The daily chart of EUR/CAD reveals a unique situation. The pair has managed to bounce off a key support level, which is emphasized in a green box on the chart. In the aftermath, a parallel channel has formed, making a case for a ‘bull flag.’ This technical pattern suggests potential future gains for the pair if it sustains its current momentum. The upper boundary of the channel, also known as resistance, is where the current price action is taking place. The price is testing this ceiling, and if it manages to break through, we could be looking at a move towards 1.51.
The Power of Fundamental Analysis
As any seasoned trader will tell you, relying solely on technical analysis can be risky. It’s important to also consider fundamental analysis—like economic indicators or geopolitical events—that can influence the EUR/CAD pair. In this context, keeping an eye on economic data releases from the Eurozone and Canada will be beneficial for substantiating the technical outlook.
Swing Trading Strategy: The Numbers
For swing traders aiming to exploit market volatility, this scenario offers excellent opportunities. If the pair breaks the resistance level highlighted in a red box, a swing trade aiming for 1.51 levels could be highly profitable. Conversely, if it fails to break out, there’s a downside potential towards 1.45.
Comparison Table: Breakout vs. Breakdown
| Scenario | Price Level Target | Market Volatility | Strategy |
|---|---|---|---|
| Breakout | 1.51 | High | Long position |
| Breakdown | 1.45 | Moderate to High | Short position |
Market Sentiment Overview
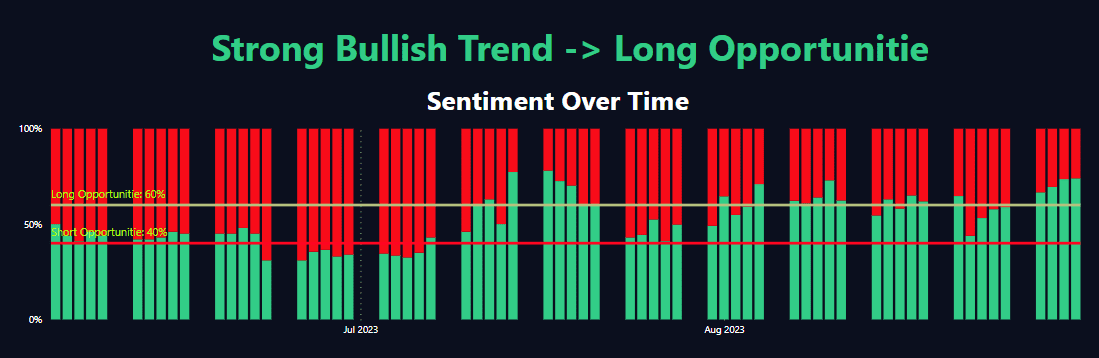
The recent period under analysis showed unusual shifts in the market sentiment for EURCAD. A majority of the market sentiment leaned bearish with short percentages often exceeding 50%. Most notably, on 2023-08-27, we saw an even split, a 50-50 distribution between short and long sentiments, which is relatively rare in the forex market. This was particularly unusual as it followed and preceded days with significant short sentiment. In the latest data from 2023-08-30, short sentiment stood at 73% while long sentiment was at 27%, showing that traders are increasingly bearish on EURCAD.
Volatility and Price Action
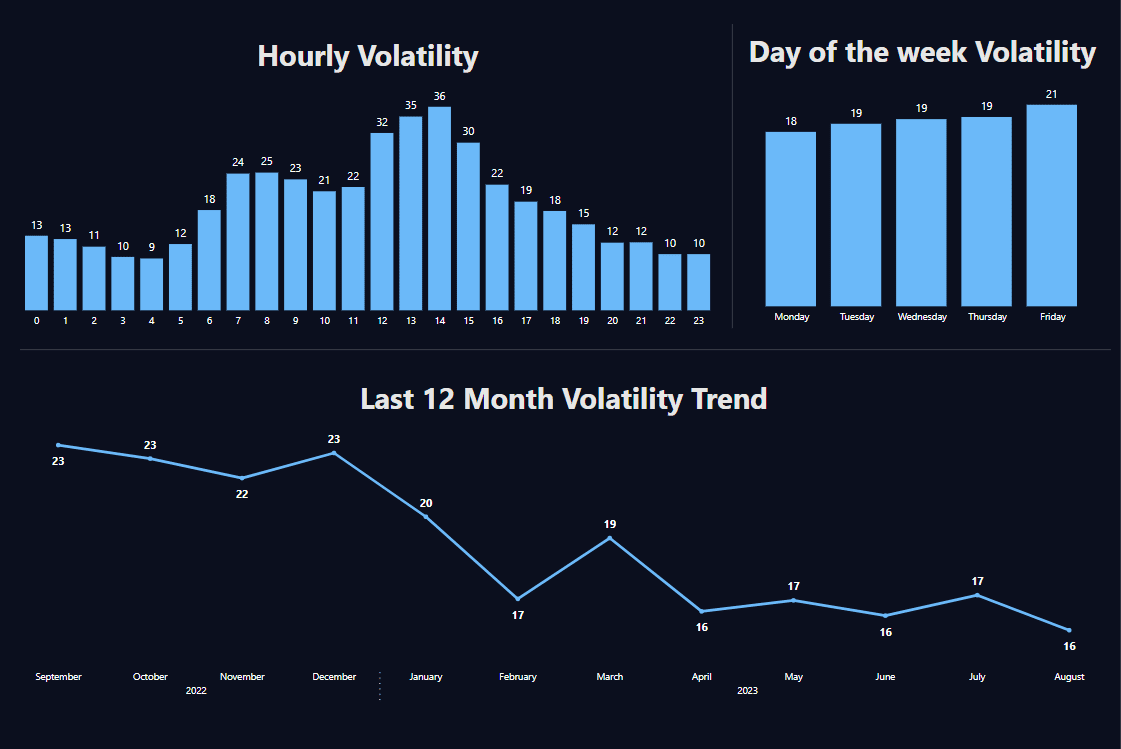
Volatility in the EURCAD pair has been quite substantial recently. On 2023-08-01, the pair showed a percentage change of 0.001124, only to see a drastic increase to 0.007427 by 2023-08-03. This abrupt change indicates a highly volatile market. Interestingly, the Bar Direction frequently shifted between ‘Up’ and ‘Down’, signaling a lack of consistent momentum in either direction. One standout instance was on 2023-08-29, where the pair moved up by 105 pips, showing a percentage change of 0.002822. This is a significant move for a single day and suggests possible overextension. The latest data on 2023-08-30 shows an ‘Up’ bar direction with a percentage change of 0.000298, which indicates that despite the strong bearish sentiment, the market is hesitant to push the pair lower aggressively.
Conclusion for This Week
The EURCAD pair appears to be at a significant juncture. The market sentiment is increasingly leaning towards the bearish side, yet the price action reveals a complex picture. This dichotomy suggests that traders should proceed with caution. Both sentiment and volatility suggest that the pair could be setting up for a significant move, but the direction is still unclear. Therefore, maintaining a flexible trading strategy could be advantageous in the coming days.
By weighing the scenarios in this comparison table, you can make an informed decision about how to position your trade. Remember, in the world of forex, it’s all about measuring your risks and rewards. Stay updated, stay informed, and happy trading!
Comments