

Main Points:
- EUR/USD Weekly Analysis: A Minor Uptick Following Six Weeks of Decline
- Market Sentiment Impacted by China’s Economic Challenges and Upcoming US Data
- Technical Analysis Indicates Bearish Momentum with a Critical Support Level at 1.0635
Understanding the Market
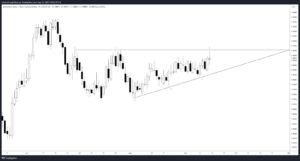
Delve into the latest EUR/USD weekly analysis, shedding light on a slight uptick observed after six consecutive weeks of decline. The currency pair hovers around 1.0810, remaining in close proximity to its recent low. To grasp the current market dynamics, let’s explore further.
EUR/USD 30-Day Forex Analysis: A Roller Coaster of Sentiment and Volatility
Sentiment Analysis
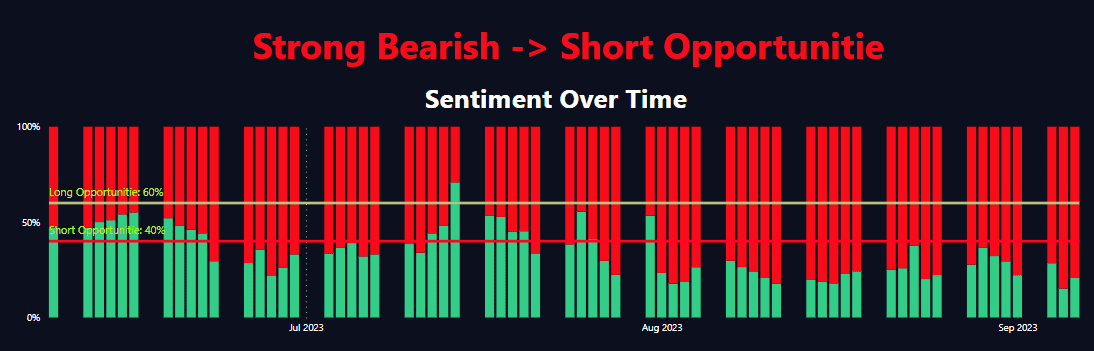
In the last 30 days, the sentiment data for the EUR/USD forex pair has fluctuated considerably. The pair started the month with a short percentage of 0.38 and a long percentage of 0.62 as of September 5th, 2023. Notably, on September 3rd, we saw an unusually high long percentage of 0.89, indicating strong bullish sentiment. However, in the final days, there was a slight reversal with the short percentage increasing to 0.41 and the long percentage decreasing to 0.59. The data suggests that traders are becoming less optimistic about the euro gaining strength against the U.S. dollar.
Volatility Analysis
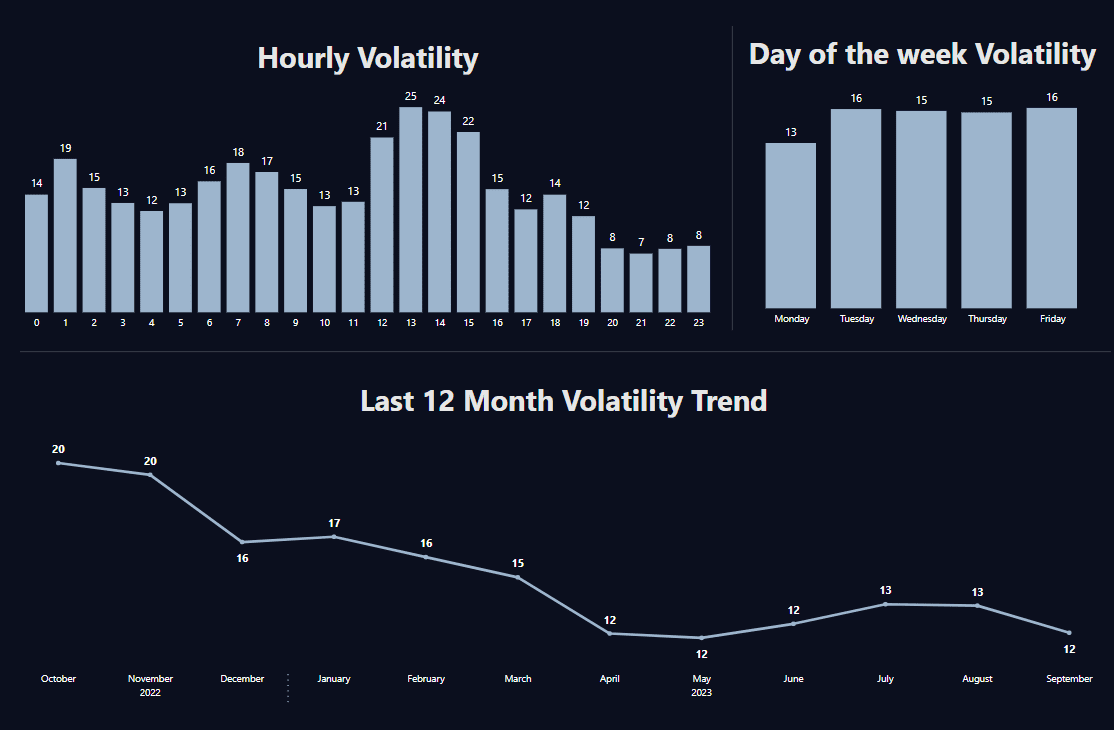
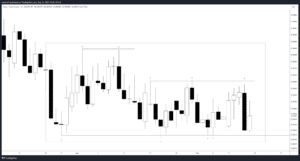
The volatility in the EUR/USD forex pair has been rather high over the last 30 days. On September 4th, the pair saw a sharp decline of 92 pips, with a percent change of -0.68%, demonstrating considerable downside volatility. This downside trend was again observed on August 31st, where the pair declined by 110.1 pips, showing a percent change of -0.61%. However, on August 29th and August 28th, the pair reversed direction, increasing by 90.4 and 109.7 pips, respectively. In terms of bar direction, there is no clear trend as ‘Up’ and ‘Down’ movements are interspersed throughout the period. It’s worth mentioning that the percent of body bar, which gauges the relative size of the candle body, has shown substantial variability, indicating a lack of consensus among traders. In terms of PctChange, the pair ranged between -0.007578 and 0.005778, emphasizing the uncertain market conditions.
Technical Analysis and Trading Strategy
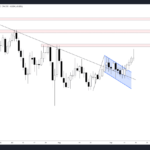
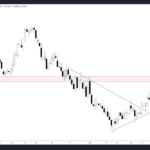
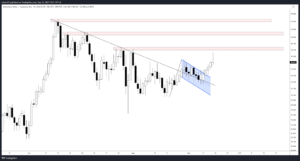
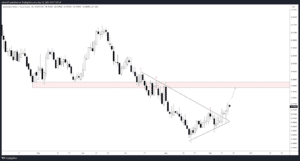
Shifting our focus to technical indicators, the EUR/USD price recently closed below the 200-day Simple Moving Average (SMA), indicating a bearish trend. It’s important to note a significant support level at 1.0635. For traders employing swing trading strategies, this level holds particular significance, potentially serving as a temporary obstacle for bearish momentum.
Comparison Table: Key Insights
| Aspect | Impact |
|---|---|
| Market Volatility | Notably Affected |
| Market Sentiment | Influenced by China and US Data |
| Fundamental Analysis | Focus on US Economic Indicators |
| Technical Support | 1.0635 – A Critical Level |
For traders, it’s essential to leverage trading tools and stay updated with technical analysis to craft effective trading strategies in the ever-evolving forex market. These tools and insights are instrumental in making informed decisions.
Conclusion for This Week
In summary, the EUR/USD pair has displayed significant volatility and changing sentiment over the past 30 days. While the pair showed high bullish sentiment in the earlier part of the month, that enthusiasm seems to be waning as we approach the end of this period. From a volatility perspective, the lack of a consistent bar direction and high fluctuations in pips change and percent change indicate that the market is uncertain. Traders should proceed with caution and utilize risk management strategies to navigate this highly volatile environment.
The initial half of the week was marked by heightened anticipation, as traders eagerly awaited essential data releases and closely monitored developments in China. The economic challenges faced by China are clearly reflected in recent data, casting uncertainty over market sentiment. Additionally, the actions of the Chinese Central Bank (PBoC) are under close scrutiny, as further measures may be necessary to support the economy.
Comments