
Main Points
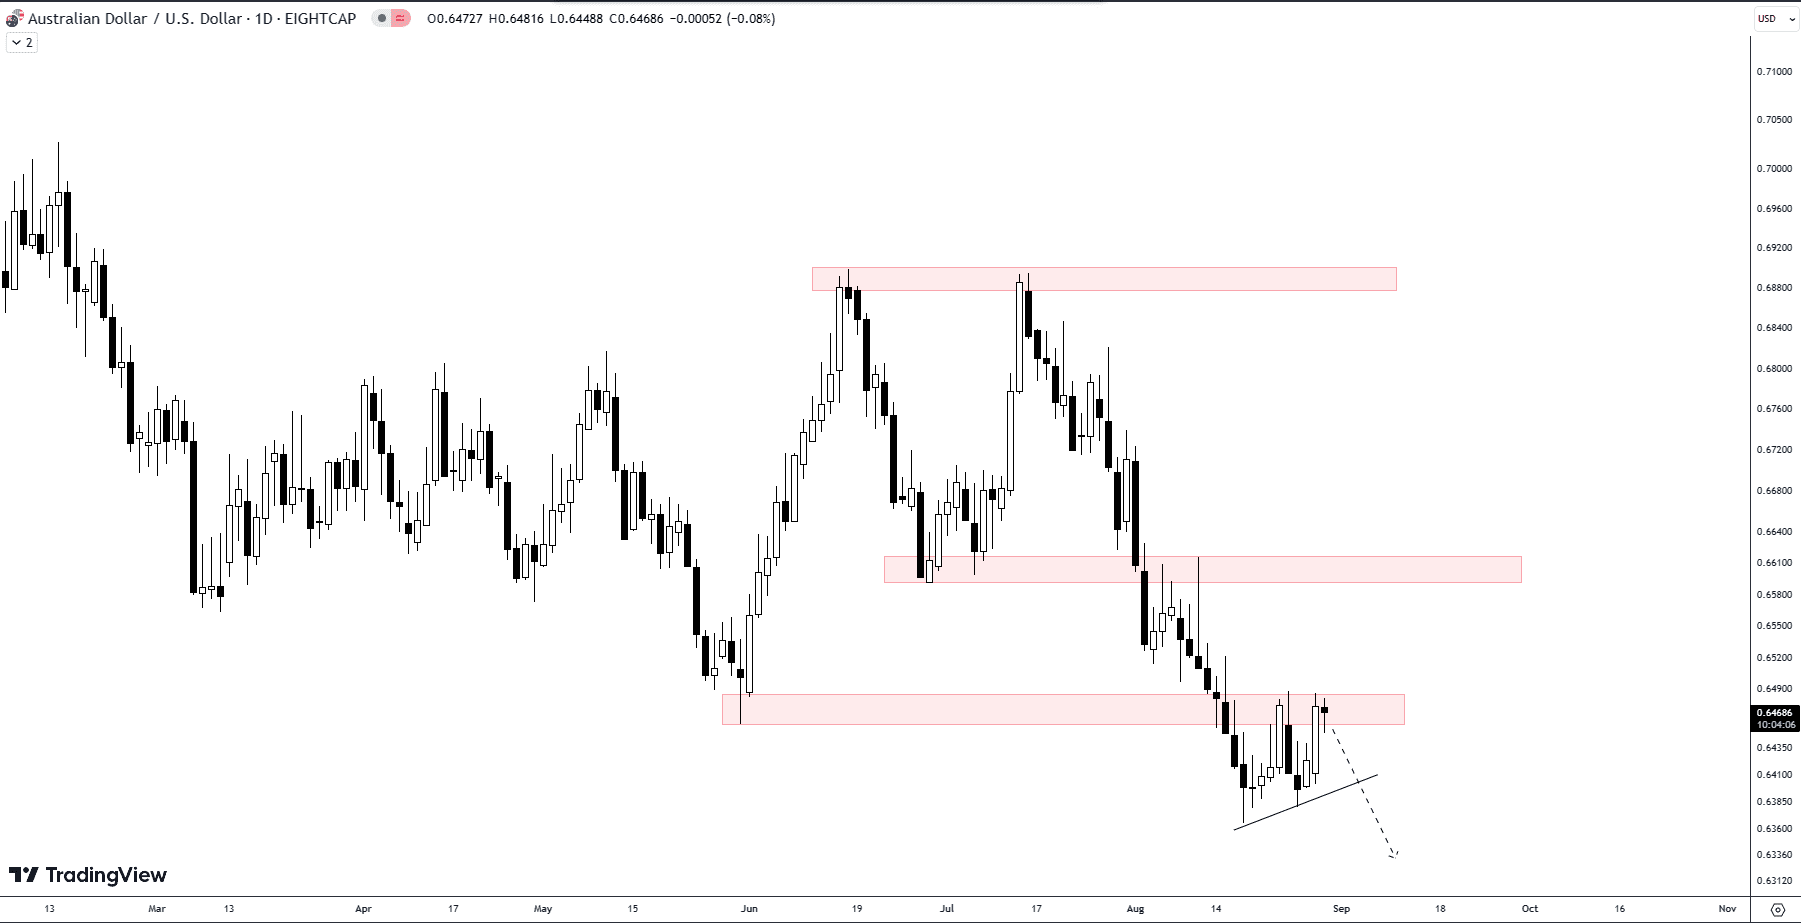
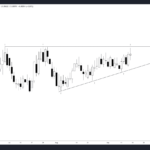
- The AUD/USD pair is experiencing bearish pressure on the daily chart, primarily after breaking a key support level.
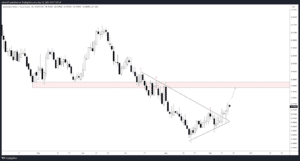
- A double-top pattern suggests potential for continuation of the bearish trend.
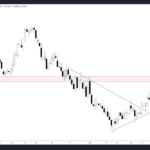
- Traders should be cautious about early sells, as several retracement areas could still come into play.
Current Market Sentiment and Technical Indicators
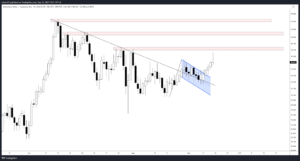
The daily chart of the AUD/USD pair paints a clear picture: the market sentiment is bearish. Since mid-July, the pair has been under significant selling pressure, a fact supported by multiple technical indicators.
From Support to Resistance: The Role Reversal
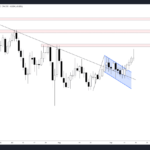
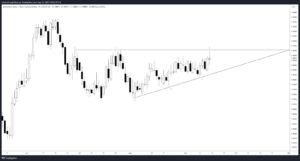
Interestingly, the AUD/USD pair has broken down past a significant support level. In forex trading, when a support level is broken, it often flips and becomes a new resistance level. This is precisely what we’re seeing now. The former support is acting as a ceiling, preventing the currency pair from climbing higher.
Fundamental Analysis: A Second Opinion
While the technical indicators suggest a bearish outlook, it’s always good practice to consult fundamental analysis for a comprehensive view. Consider Australian economic indicators like employment rates or U.S. factors like interest rate changes, as these can shift the market sentiment and add another layer of complexity to your trading strategy.
Double-Top and Swing Trading Opportunities
If you’re into swing trading, you’ll find the double-top pattern noteworthy. This pattern has already been tested twice, signaling that the bearish trend might continue. However, it’s crucial to prepare for market volatility. A failed double-top pattern could mean that it’s too early to sell, as the pair may still test multiple retracement areas.
Comparison Table: Bearish Continuation vs. Retracement
| Scenario | Price Action | Market Volatility | Trading Strategy |
|---|---|---|---|
| Bearish Continuation | Downward | High | Sell Position |
| Retracement | Upward (Short-term) | Moderate | Wait and Observe |
The Rollercoaster of AUD/USD: A 30-Day Review
Sentiment Analysis: Bullish vs. Bearish
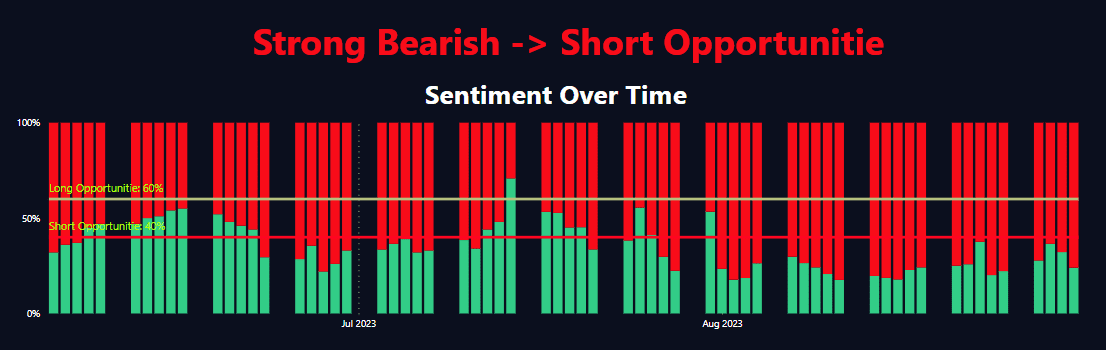
In the last 30 days, the sentiment data for the AUD/USD pair indicates a gradual leaning towards a bearish sentiment. For instance, the percentage of short positions went from 0.16 on August 6th to 0.34 on August 1st. Long positions decreased from 0.84 to 0.66 in the same period. It’s particularly interesting to note that the highest bearish sentiment (0.34 short positions) occurred on August 1st and August 2nd, coinciding with a significant drop in price. This is a classic case where market sentiment corroborates the price action.
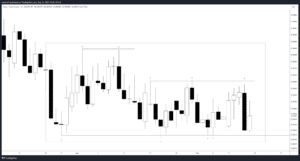
Volatility Highlights: The Dance Between Open and Close
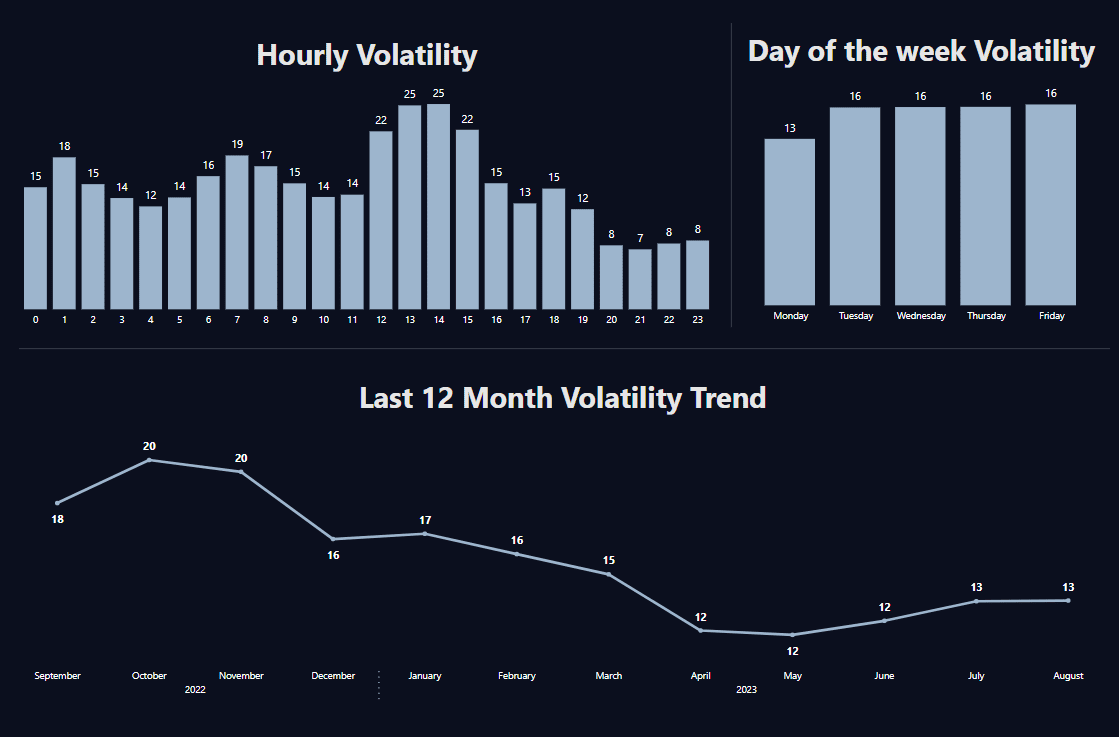
When it comes to volatility, the AUD/USD pair has shown some considerable fluctuations in the past month. Let’s take a glance at the extremes: On August 2nd and August 1st, the pair experienced significant price changes, with the Percent Change showing -0.011280 and 0.001927 respectively. The % Body Bar data, which measures the percentage size of the candle body relative to the range, also saw variations from 0.724273 to 0.231189 on these days. The largest pip change occurred on August 9th, with a staggering 102.5 pips. These kinds of fluctuations can offer great opportunities for traders, but they also come with heightened risk.
Unusual Spikes and Interesting Trends
It is rather unusual to see a spike in bearish sentiment, from 0.16 to 0.34, in such a short time frame of a month, especially when coupled with significant price changes. It suggests that traders should pay close attention to both sentiment data and volatility indicators to catch the potential trend reversals or continuations. Another interesting point is the sudden jump in pips on August 9th; such spikes often signal a market event or news affecting the currency pair.
Conclusion for This Week
This week’s analysis on AUD/USD points to heightened market volatility coupled with a growing bearish sentiment. For traders, this implies potential shorting opportunities. However, due diligence is necessary; consider both technical indicators and market sentiment when making trading decisions. Keep an eye out for sudden spikes in volatility or shifts in sentiment as these could be indicative of upcoming market events or trend reversals.
To sum up, the AUD/USD pair is showing strong signs of bearish momentum on the daily timeframe. However, traders should approach this market with a balanced perspective, combining both technical indicators and fundamental analysis. Being aware of both can help you navigate through market volatility and make more informed decisions.
Comments