
Main Points:
- AUD/USD analysis exhibits bearish momentum following a double top formation.
- Technical analysis reveals a breakdown of the plotted trendline, indicating seller strength.
- Volatility analysis using a Volatility Heat Map provides key insights for traders.
AUD/USD – Bearish Momentum and Trendline Breakdown
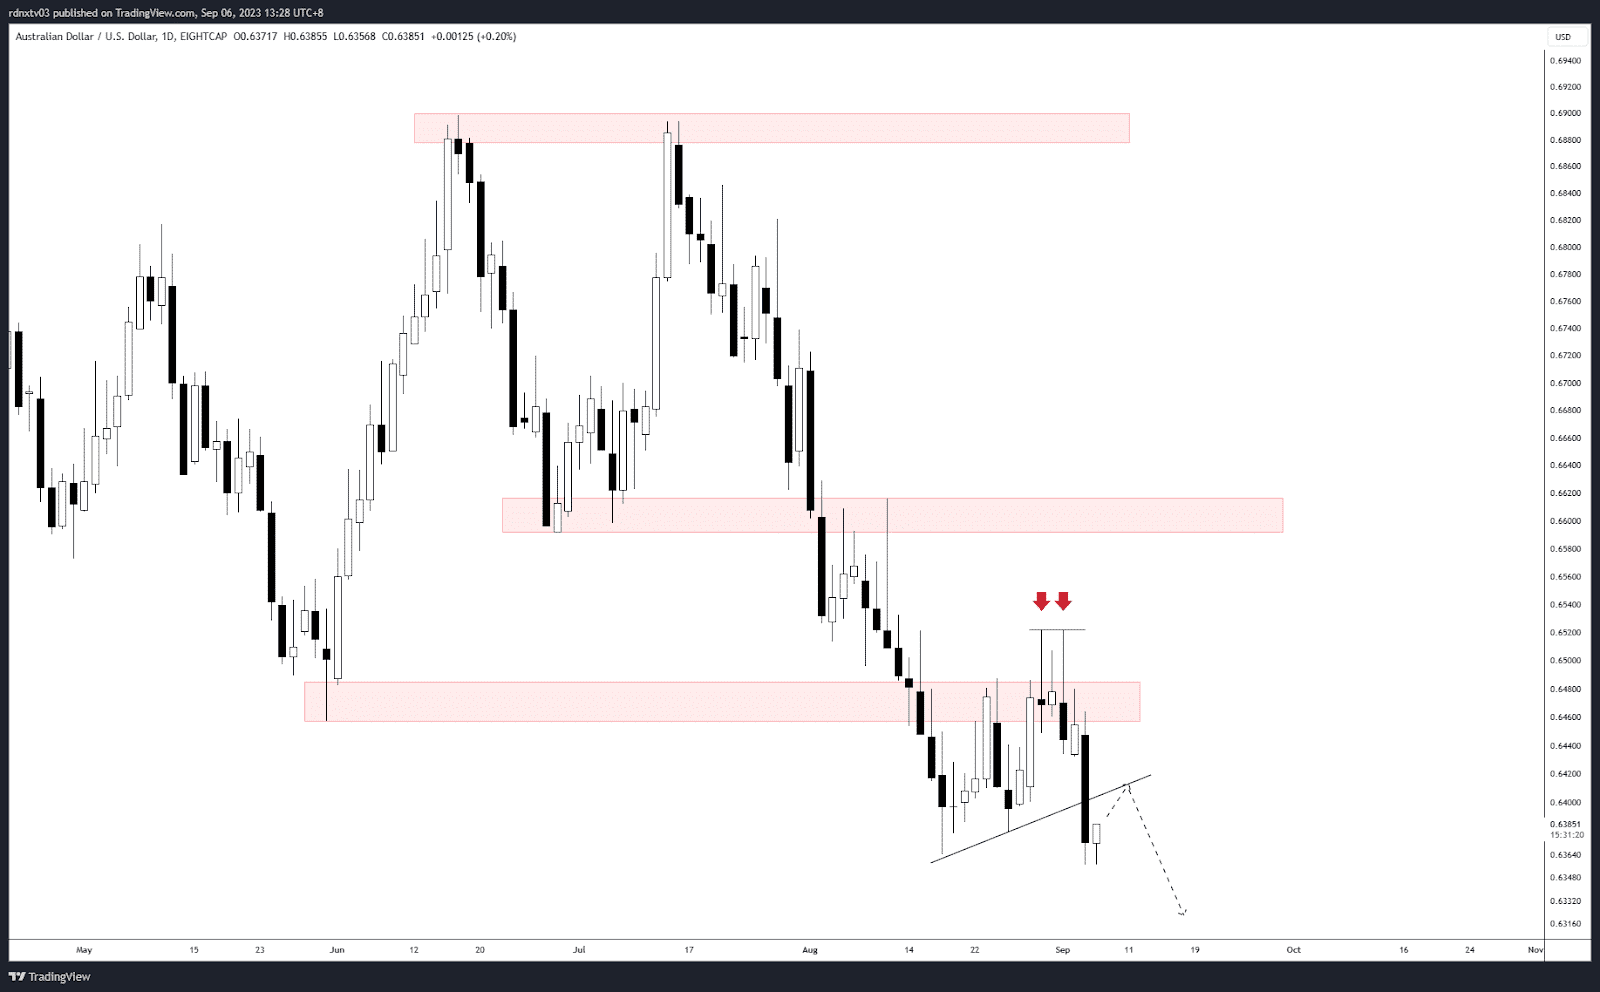
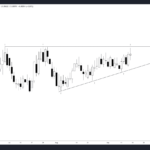
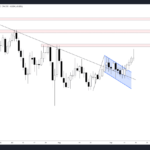
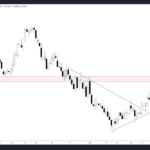
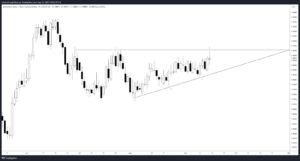
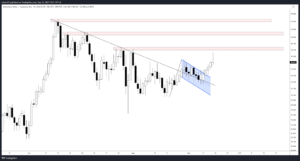
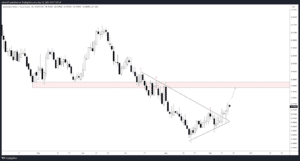
In this week’s AUD/USD analysis, we continue to observe the bearish bias that materialized after the formation of a double top, highlighted by two prominent red arrows. This pattern signified inherent weakness and eventually led to the breakdown of our carefully plotted trendline. The strength of the resistance became evident through a substantial bearish candle, indicating a swift momentum shift favoring sellers.
Following the pronounced bearish move, the price now appears to be in a state of stalling. It seems to be seeking validation for the recent trendline breakdown by attempting a retest. This retest may serve as a precursor to a potential continuation of the downward trajectory in the near future.
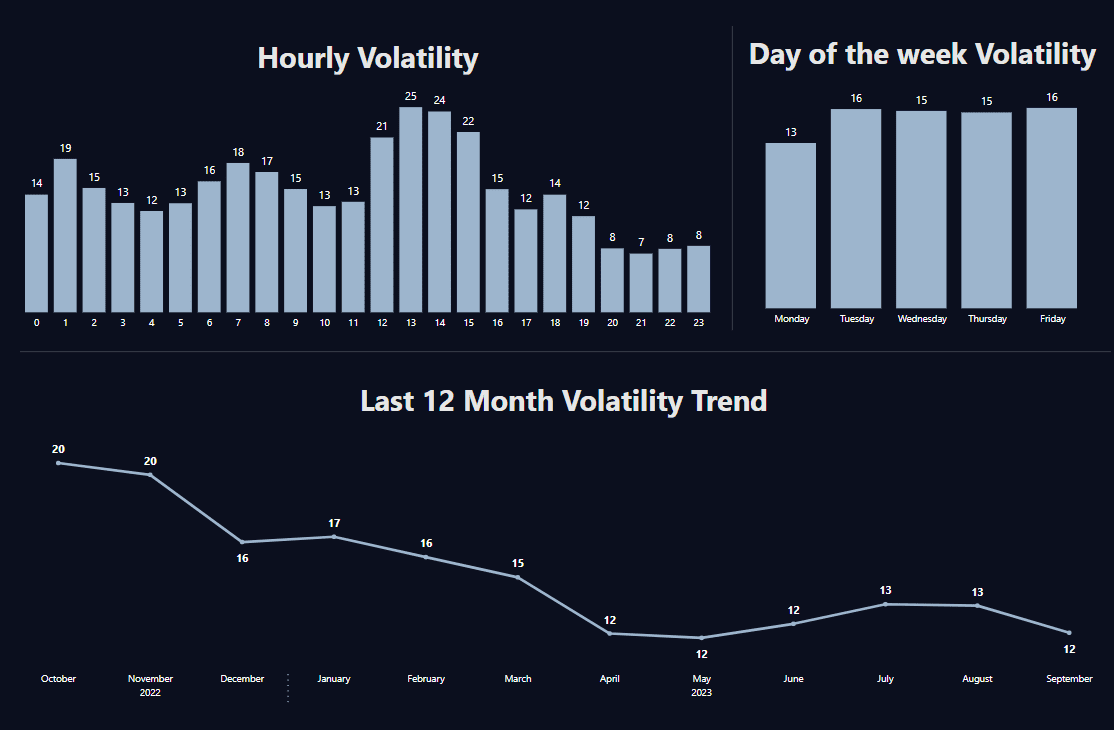
Volatility Insights: Using the Volatility Heat Map
As traders assess the AUD/USD dynamics, it’s crucial to consider market volatility. Utilizing a Volatility Heat Map, we gain valuable insights into the currency pair’s price movements. This tool provides a visual representation of volatility levels across different time frames.
The Volatility Heat Map helps traders identify periods of heightened volatility, enabling them to adjust their strategies accordingly. By monitoring and aligning their trading decisions with volatility data, traders can better navigate the ever-changing forex landscape.
Comparison Table: Key Indicators
| Indicator | Observation |
|---|---|
| Market Sentiment | Bearish |
| Fundamental Analysis | Neutral |
| Technical Indicators | Support for Bearish Momentum |
Trading Strategy and Technical Analysis
For traders considering positions in AUD/USD, a cautious approach is advisable due to the ongoing bearish momentum. Technical indicators suggest support for the current downward trend. However, it’s essential to await confirmation of the trend continuation after the retest of the broken trendline.
Volatility tools, such as the Volatility Heat Map, should be integrated into trading strategies to align with market dynamics effectively. Maintaining a keen eye on market sentiment and fundamental analysis is equally vital in adapting to changing conditions and making informed trading decisions.
Remember that forex trading carries inherent risks, and risk management strategies should always be an integral part of your trading approach.
An In-Depth Look at AUDUSD’s Volatility and Sentiment Over the Past 30 Days
Sentiment Analysis
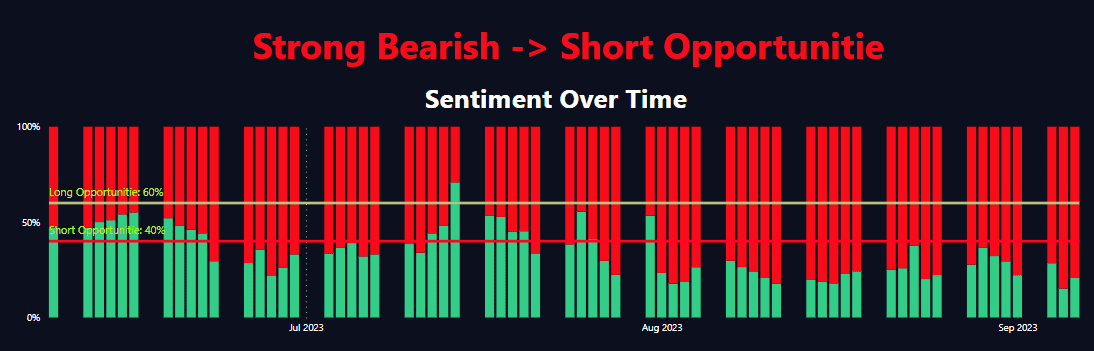
Over the past thirty days, AUDUSD has experienced fluctuations in both short and long positions. On the short side, percentages ranged from 14% to 32%, while long percentages oscillated between 68% and 86%. Notably, the long sentiment has generally outweighed the short sentiment, especially on days like 2023-08-13 and 2023-09-05 when long percentages were as high as 86% and 82% respectively. Despite this bullish inclination from market participants, the pair hasn’t shown any significant upward trend in the last days of the analysis.
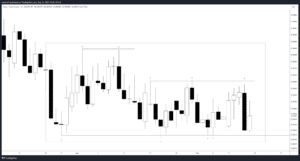
Technical Analysis on Volatility
During the past 30 days, the AUDUSD currency pair exhibited substantial volatility with significant pip movements on certain days. For instance, on 2023-09-04, the pair saw a considerable decline with a 107.1 pip change, closing at 0.63777 from an opening of 0.64601. This day was one of the most bearish with a percent change of -0.012755. Furthermore, the ‘PctBodyBar’ also remained high on that day at 0.769373, indicating a strong bearish body. In contrast, 2023-08-28 saw an increase with an 85.5 pip change, closing at 0.64796 and a percent change of 0.008718, making it one of the most bullish days in recent times. The ‘PctBodyBar’ remained substantial at 0.654976, indicating a strong bullish body. The most recent day in our analysis, 2023-09-05, saw a moderate decline with an 8.5 pip change, closing at 0.6373 from an opening of 0.63800.
Conclusion for This Week
In conclusion, the sentiment data suggests a general bullish inclination among traders over the past month, although this has not translated into a robust upward movement for AUDUSD. On the volatility front, the currency pair has shown significant pip changes both on the upside and the downside, indicating a turbulent market environment. Traders should proceed with caution and possibly employ hedging strategies to mitigate risks.
Comments