
Main Points:
- AUD/JPY signals bullish momentum after breaking key trendline resistance.
- Bullish flag pattern formation suggests potential upward movement.
- Expectations of price reaching 94.00 levels if a breakout occurs.
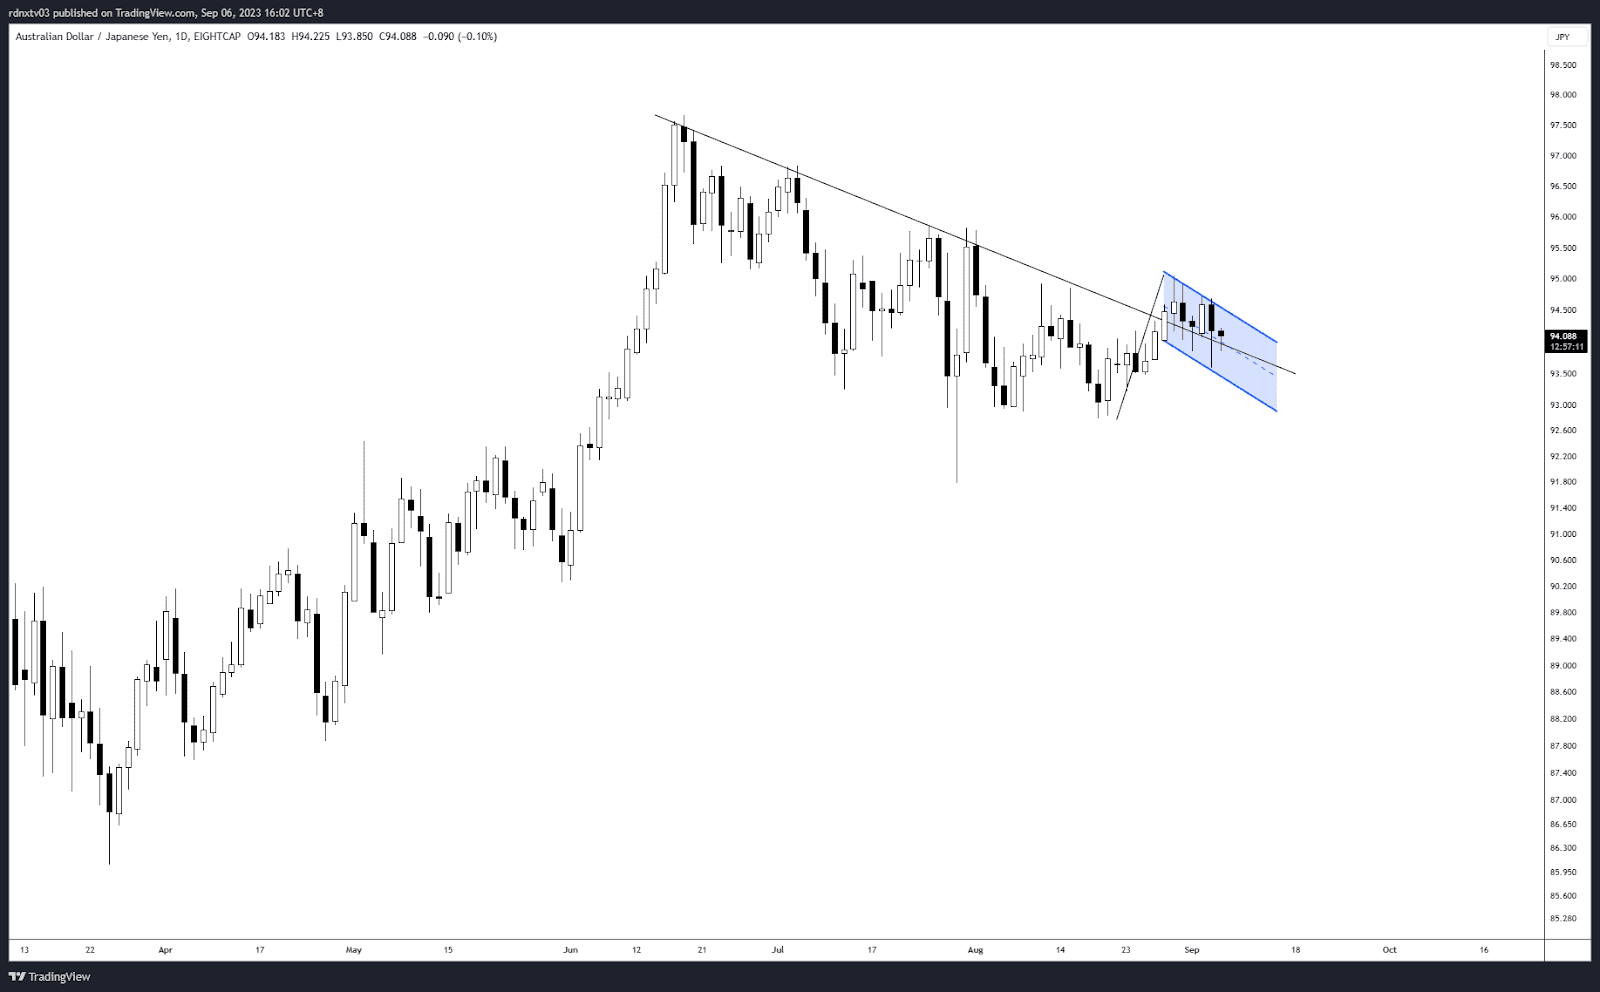
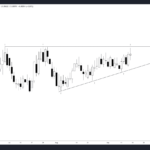
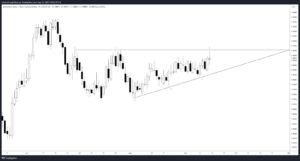
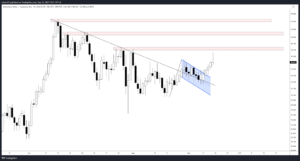
AUD/JPY – Bullish Momentum and Trendline Breakout
In this weekly analysis of AUD/JPY, we explore its bullish momentum as it successfully breaks above a significant trendline. The pair consolidates above this key resistance, forming a strong support level for bullish traders. Notably, a bull flag pattern has emerged in the price chart, characterized by daily candle prints and multiple rejections at the lower boundary of the flag.
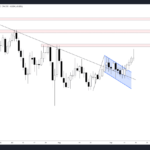
Expectations and Resistance Levels
If AUD/JPY manages to break out in the upcoming days, it could potentially target price levels around 94.00. This level represents both the peak of the trendline and a historically significant resistance point. Traders should closely monitor this breakout scenario as it could offer attractive trading opportunities.
Comparison Table: Key Indicators
| Indicator | Observation |
|---|---|
| Market Volatility | Moderate |
| Market Sentiment | Bullish |
| Fundamental Analysis | Positive Outlook |
| Technical Indicators | Bullish Signals |
Utilizing Technical Analysis and Volatility Tools
For traders considering positions in AUD/JPY, it’s essential to leverage technical analysis to align with the bullish sentiment. Additionally, utilizing volatility tools can help identify potential entry and exit points while navigating market dynamics effectively. Staying informed about market volatility, sentiment shifts, and fundamental analysis is essential for making well-informed trading decisions.
Analysis of Sentiment Data
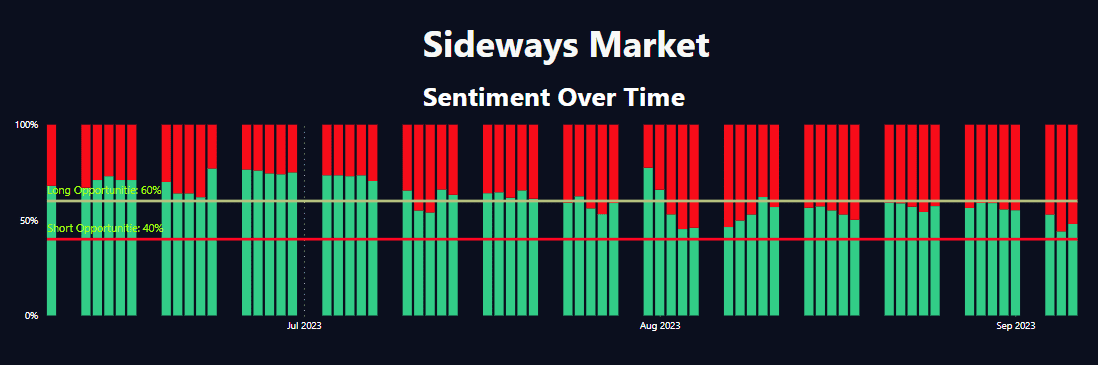
Looking at the sentiment data for the AUDJPY pair, it’s evident that the sentiment has been relatively balanced over the past 30 days. Most of the time, the long and short percentages hover around 50%, suggesting an indecisive market. However, there was a distinct anomaly on August 27, 2023, where short sentiment was at 0.65 and long sentiment was at 0.35, indicating a strong bearish sentiment. Despite this, the price went up, possibly due to some external factors or market noise. Over the last week, the market has leaned more towards a bullish sentiment with an average of 0.54 longPercentage, signaling possible bullish moves in the coming days.
Analysis of Volatility Data
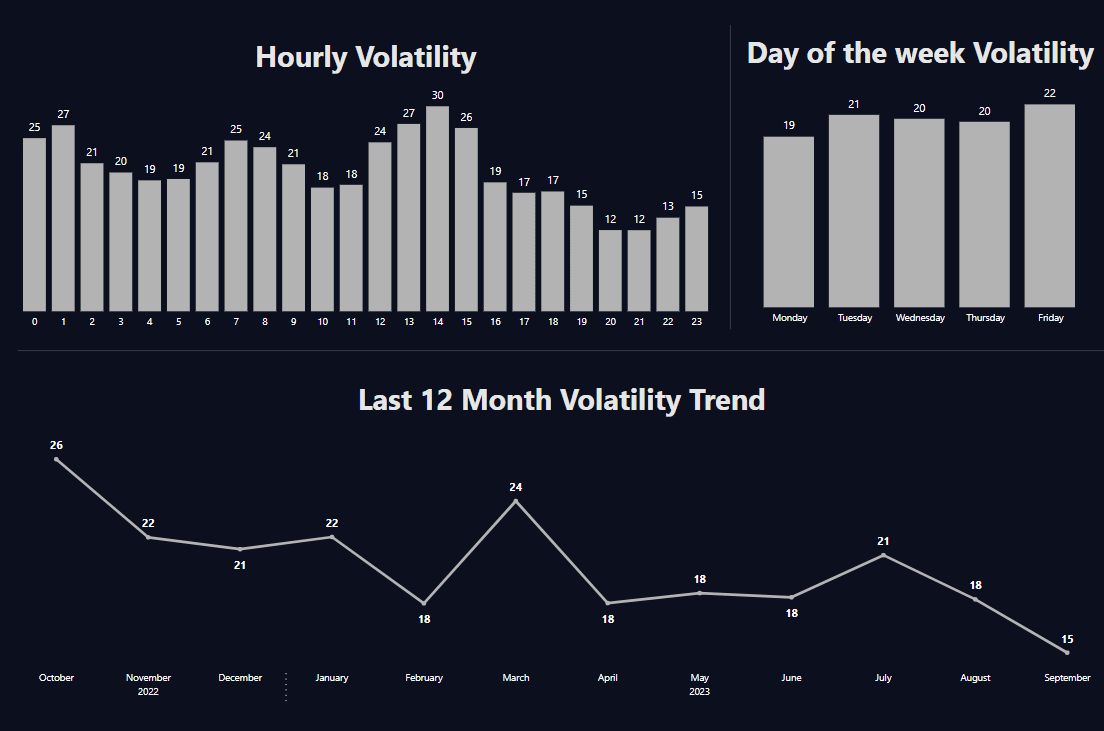
From the volatility data, a few points stand out. The pair has seen both upward and downward movements, making it crucial for traders to keep an eye on entry and exit points. For instance, on September 5, 2023, the pair opened at 94.218 and closed at 93.998, moving downwards by 29.5 pips with a -0.23% change. This contrasts with September 3, 2023, where the pair moved up by 52.6 pips with a 0.47% change. One interesting observation is the fluctuation in ‘PctChange’ and ‘PctBodyBar’, which signifies market indecision. However, August 20, 2023, saw a 0.68% positive change, the highest in the last 30 days, suggesting a potential bullish sentiment. During the past week, we have observed a downward pressure with the pair losing around 0.5% of its value. It’s essential to note the changes in Bar Direction, as they give a preliminary understanding of market trends. For the last days in this analysis, it is clear that the bearish sentiment is growing.
Conclusion for This Week
This week has showcased a blend of both bearish and bullish tendencies for the AUDJPY pair. Sentiment data indicates a slight lean towards bullishness, although the past week has seen a net decrease in value. The volatility data underscores the need for traders to be vigilant, especially considering the changeable Bar Directions and percentage changes. With market sentiment and volatility not entirely in sync, traders should exercise caution and possibly employ a hedging strategy to mitigate risks.
Explore More Forex Articles
For in-depth insights into forex trading strategies, technical indicators, and market analysis, explore our comprehensive collection of forex articles. Stay ahead of market trends and enhance your trading skills with our valuable resources.
Comments