
Main Highlights:
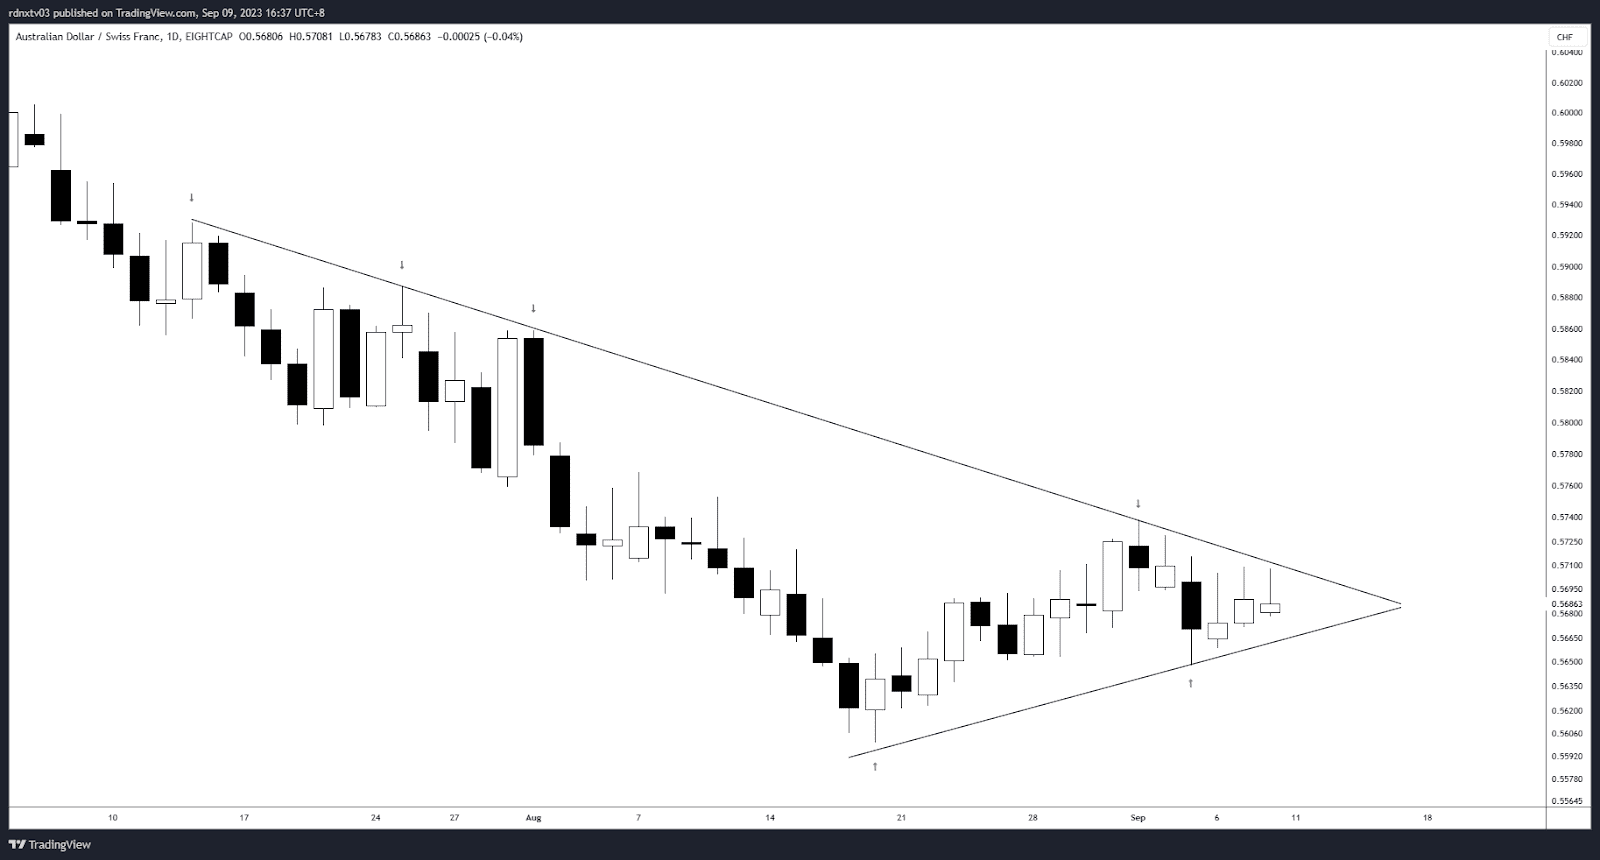
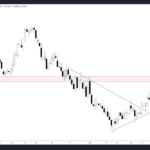
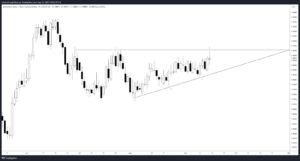
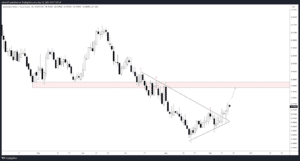
- AUD/CHF currently exhibits a neutral bias with a symmetrical triangle pattern.
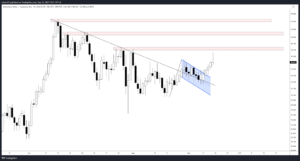
- A bearish trendline has been tested four times, making it a key level for potential reversal.
- Understanding the implications of a breakdown from the symmetrical triangle is crucial for traders.
Analysis of AUD/CHF’s Neutral Bias
The AUD/CHF currency pair is currently in a state of neutrality, marked by the formation of a symmetrical triangle pattern. This pattern suggests a balance between buyers and sellers and often hints at potential trend reversals. However, given AUD/CHF’s recent bearish momentum, this formation could provide insights into a reversal of the existing trend.
Unraveling the Triangle Pattern Trading Strategy
Imagine you’re out hiking, and you spot a triangle-shaped trail sign. It’s directing you, giving you insight on which path to take, right? The world of forex has its own ‘trail signs’, and the triangle pattern is a captivating one!
A Deep Dive into the Triangle
In the bustling forex market, the triangle pattern signals a consolidation before a big breakout. Whether it’s ascending, descending, or symmetrical, it’s like the calm before a storm. And while it’s a remarkable tool, pairing it with Forex Sentiment Analysis and Volatility Analysis can be a game-changer.
Triangle vs. Market Mood
| Tool | Benefit |
|---|---|
| Triangle Pattern | Signals potential price breakout |
| Forex Sentiment Analysis | Gauges traders’ feelings about a currency pair |
Top 3 Unexpected Moments with Triangle Patterns
- Spotting them on my daughter’s geometry homework and thinking of potential trades.
- Realizing the calming consolidation period is a lot like meditating before a busy day.
- Wishing every life decision had a clear triangle pattern to guide the way.
Key Reversal Level: Bearish Trendline
An important feature on the AUD/CHF chart is the bearish trendline that has undergone testing on four occasions. This trendline represents a significant level for traders, as a breakout from it may signal a potential reversal of the current trend. Traders should closely monitor this level for any signs of a breakout, as it may present an attractive trading opportunity.
Understanding the Breakdown Scenario
While the symmetrical triangle indicates a pause in the prevailing market sentiment, it is essential to consider the possibility of a breakdown from this pattern. A breakdown would imply a continuation of the bearish momentum observed in recent times. Traders should prepare for both scenarios and develop trading strategies aligned with their AUD/CHF analysis.
Comparison Table of Key Indicators
| Indicator | Observation |
|---|---|
| Technical Analysis | Symmetrical Triangle and Bearish Trendline |
| Trading Tools | Utilizing Tools for Effective Analysis |
| Volatility Heat Map | Assessing Market Volatility |
Enhancing Your Forex Knowledge
Stay informed and enhance your understanding of forex trading strategy, chart patterns, and market analysis through our educational articles, trading strategies, and glossaries. With over 700 articles available, you can expand your knowledge and make more informed trading decisions.
Questions Worth Pondering
- Q: Are all triangle patterns indicative of a breakout?
A: Not always, but they often suggest a strong move is on the horizon. - Q: How can I be sure the breakout will be in my favor?
A: Pairing it with sentiment and volatility analysis can help increase your odds. - Q: Can triangle patterns be spotted in daily life?
A: Absolutely! They’re everywhere once you start looking.
Comments