
Main Highlights:
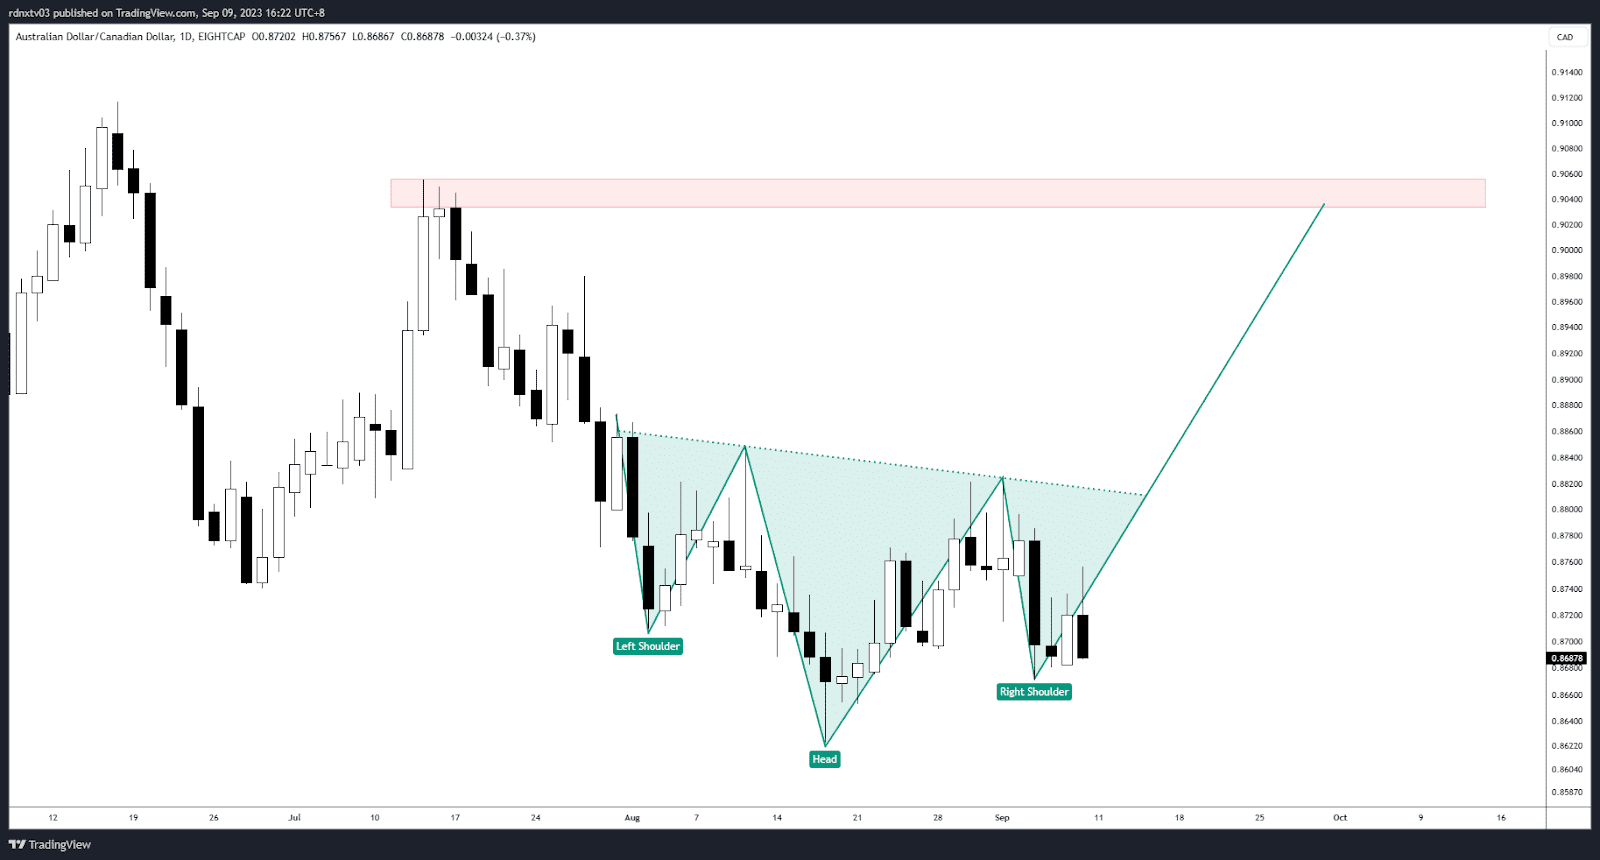
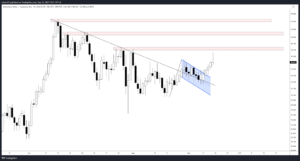
- AUD/CAD has experienced a month-long bearish trend since reaching its peak at 0.9050.
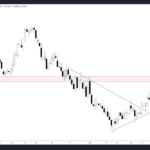
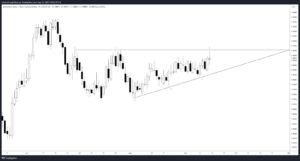
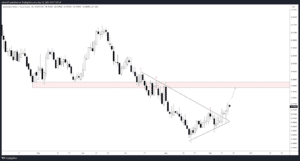
- Potential reversal signals, including the emergence of an inverse head and shoulders pattern, are observed.
- A breakthrough above the pattern’s neckline could trigger a bullish rally towards the 0.9050 resistance level.
AUD/CAD – Bearish Momentum Overview
The AUD/CAD currency pair has been gripped by a month-long bearish momentum since its peak at 0.9050. However, recent developments suggest a potential shift in market sentiment as the sellers’ momentum slows down. Notably, an inverse head and shoulders pattern has appeared, renowned for its high probability of signaling reversals, especially at the conclusion of a bearish trend – precisely the scenario we find ourselves in. Breaking above the pattern’s neckline in the coming days could see AUD/CAD surging towards the 0.9050 resistance level.
Utilizing Technical Analysis
Traders closely monitor technical indicators and chart patterns to gauge the strength and validity of this potential reversal. Employing technical analysis tools and strategies is crucial for identifying optimal entry and exit points in such market conditions. Understanding these patterns and their implications is vital for successful forex trading.
Key Indicators Comparison
| Indicator | Observation |
|---|---|
| Market Sentiment | Transitioning from Bearish to Cautiously Bullish |
| Technical Indicators | Identification of Inverse Head and Shoulders Pattern |
| Volatility Calculator | Evaluating Market Volatility |
Trading Strategies and Education
For traders aiming to capitalize on potential reversals and chart patterns like the inverse head and shoulders, staying informed and educated is essential. Explore our extensive collection of educational articles, volatility tools and trading strategy to enhance your forex trading skills and make well-informed decisions.
Comments