
Main Points:
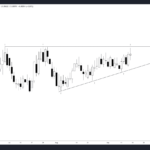
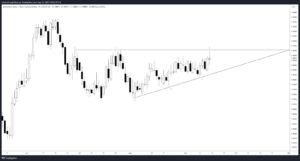
- The weekly chart indicates a strong uptrend for USDJPY.
- A resistance level has been identified, which might challenge the bullish momentum.
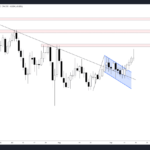
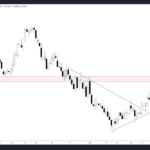
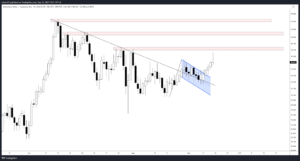
- The daily timeframe underscores significant buy signals.
Analysis of the Uptrend
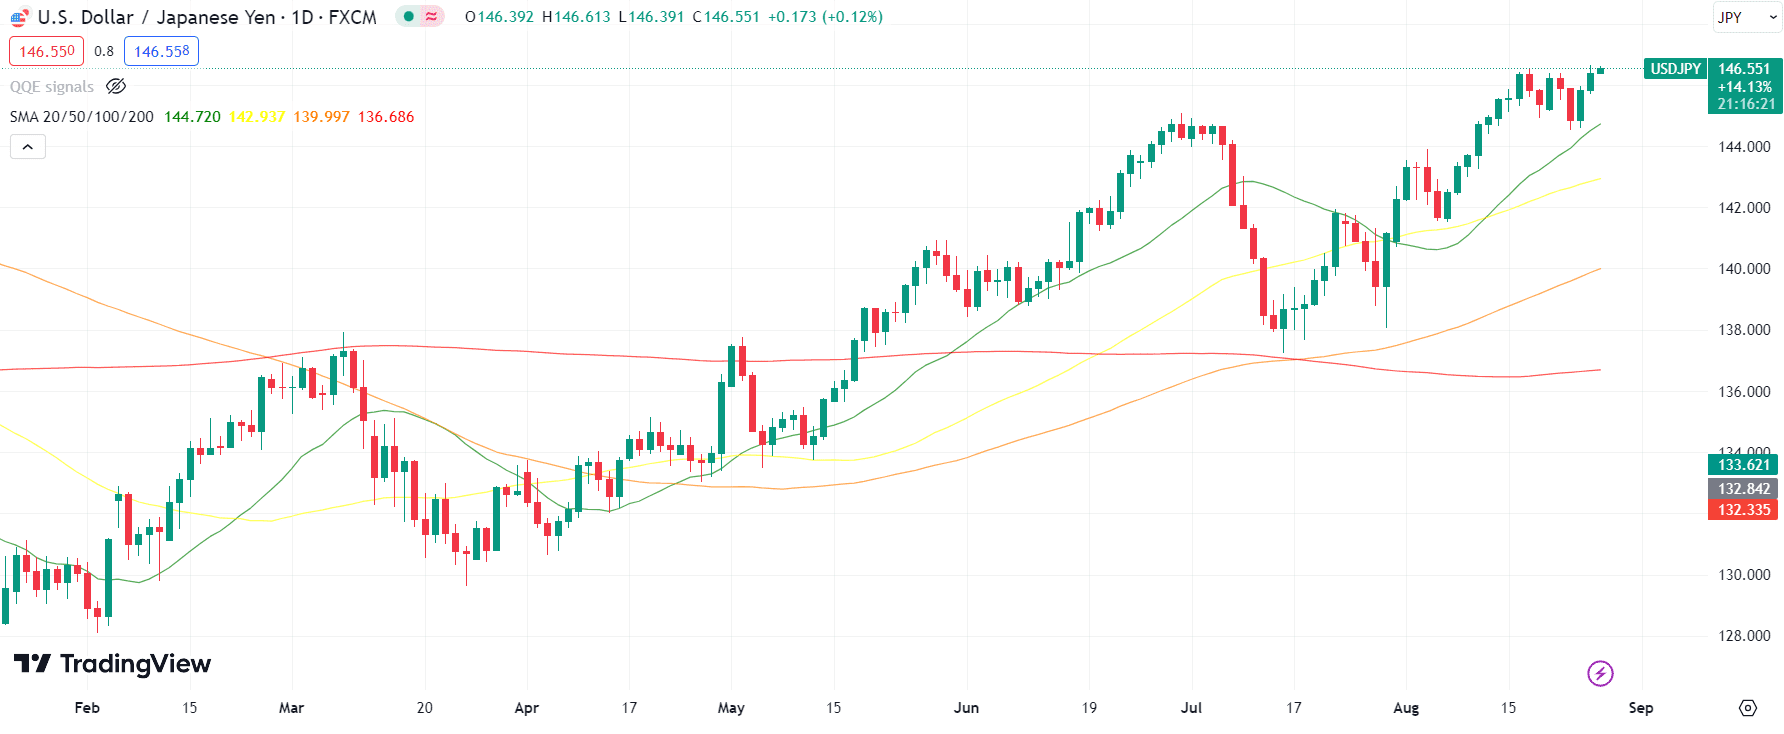
Taking a glance at the weekly chart for USDJPY, there’s a prominent uptrend. This denotes a consistent strength in the U.S. dollar against the Japanese yen. Historically, uptrends in the forex market often result from one currency’s relative economic strength or from favorable interest rate differences.
Resistance Ahead
While the uptrend is evident, traders should be wary of a looming resistance level. This level, often determined by historical price points where the currency pair had previously faced selling pressure, may pose challenges for the USDJPY’s continued upward trajectory. A break above this resistance could solidify the pair’s bullish stance, while a rejection might lead to a temporary pullback.
Daily Timeframe Insights
Zooming into the daily timeframe, the USDJPY has shown significant buy signals over the recent days, further supporting the uptrend spotted in the weekly chart. This suggests that, in the short term, there’s a higher possibility of the pair continuing its climb, unless countered by major economic news or events.
Comparison Table
| Timeframe | Trend | Key Levels |
|---|---|---|
| Weekly | Uptrend | Notable resistance ahead |
| Daily | Bullish momentum | Recent buy signals |
Unraveling the Sentiment & Volatility Trends
Sentiment Analysis for USDJPY
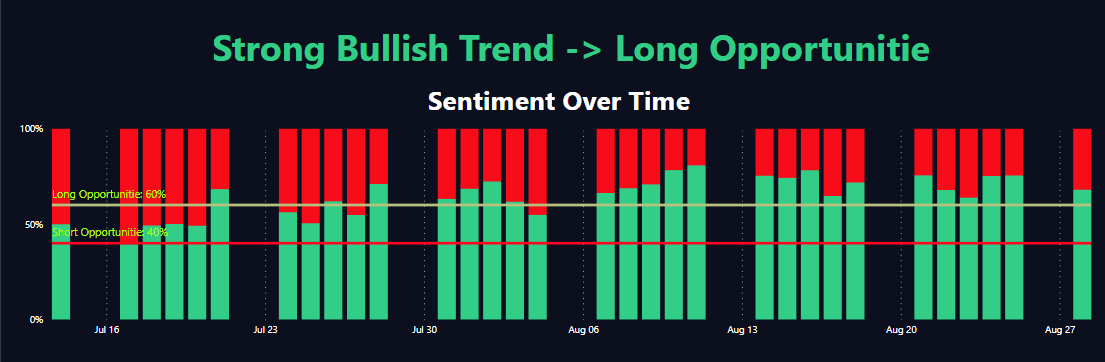
The sentiment around the USDJPY over the recent period has mostly favored the shorts, with more traders betting on the pair’s decline. This can be observed from the consistently high short percentages. On the last day of analysis, for instance, 77% of traders were short while only 23% were long. The data seems to reveal a cautious approach from traders, especially in light of potential risks or uncertain market events. Interestingly, despite the higher short sentiment, the price has seen a consistent bullish movement, suggesting the possibility of an upcoming squeeze if these short positions start to close.
Volatility Insights
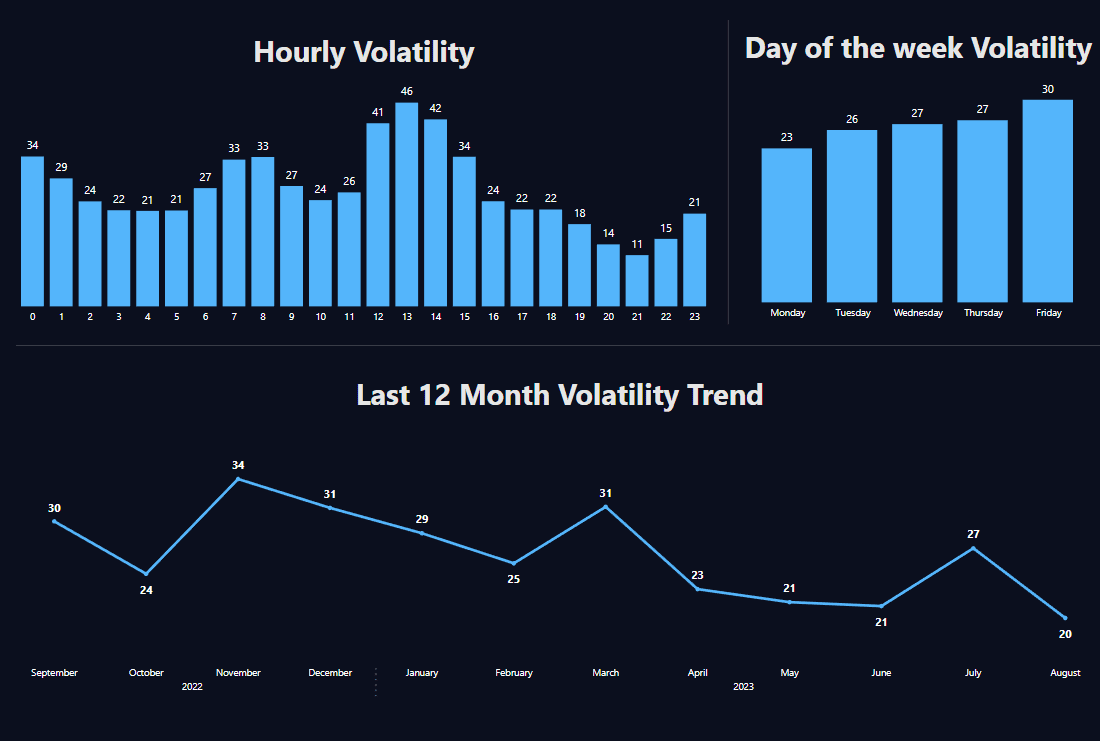
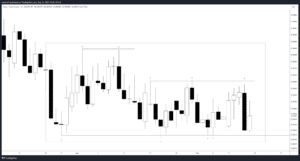
Volatility offers a clear view of the market’s enthusiasm and direction, and the USDJPY hasn’t disappointed. On the last day, the pair opened at 146.449997 and closed slightly higher at 146.507996, indicating a bullish bar direction with a modest 20.7 pip change. This mirrors the general uptrend observed in the data, with a few exceptions. For example, on the date 2023-08-22, the pair experienced a sharp drop, opening at 145.820999 and closing at 144.852997, translating to a 134 pip decrease. Such fluctuations provide traders with opportunities, either to capitalize on short-term trades or adjust their long-term strategies. The percentage change in price over the analyzed period showcases a notable volatility with values ranging from minuscule 0.000007% to a significant 0.008686%. This degree of volatility signifies active trading sessions and considerable interest in the pair.
Navigating the Week’s Economic Pivots
Foreseeing Key Indicators
The upcoming week promises several crucial economic indicators for both the US and Japan that could potentially sway the USD/JPY trading dynamics. With pivotal data releases including job openings, consumer confidence, and crude oil stock changes in the US and unemployment figures from Japan, traders are bound to be on their toes, awaiting insights that could hint at either currency’s strength or vulnerability.
Upcoming Economic Events
| Date | Country | Indicator | Previous | Forecast | Currency | Importance |
|---|---|---|---|---|---|---|
| 2023-08-28 | JP | Unemployment Rate | 2.500 | 2.500 | JPY | Medium |
| 2023-08-28 | US | Dallas Fed Manufacturing Index | -20.000 | -21.600 | USD | Medium |
| 2023-08-29 | US | JOLTs Job Openings | 9.582 | 9.465 | USD | High |
| 2023-08-29 | US | CB Consumer Confidence | 117.000 | 116.000 | USD | Medium |
| 2023-08-29 | US | API Crude Oil Stock Change | -2.418 | N/A | USD | Medium |
| 2023-08-29 | US | S&P/Case-Shiller Home Price MoM | 1.500 | 0.600 | USD | Medium |
| 2023-08-29 | US | S&P/Case-Shiller Home Price YoY | -1.700 | -1.300 | USD | Medium |
Main Points:
- The US JOLTs Job Openings indicator holds high importance, potentially offering a hint at the country’s employment landscape.
- Japan’s unemployment rate remains steady at 2.5%, indicating stability in its labor market.
- US home price data from S&P/Case-Shiller might offer insights into the housing market’s trajectory, especially given its YoY dip.
Conclusion for This Week
USDJPY has exhibited interesting dynamics in terms of both sentiment and volatility. While the predominant sentiment leaned towards the short side, the price action narrated a different story, pointing towards a bullish trend. This contradiction may lead to exciting developments in the upcoming days. The volatility showcased is in line with the pair’s popularity, offering numerous opportunities for traders. As always, it’s crucial to be prepared and vigilant, understanding both the sentiment and volatility to make informed decisions.
The USDJPY pair, when viewed on both the weekly and daily charts, indicates a strong bullish momentum. However, traders should remain vigilant and monitor the identified resistance level, which could be a crucial determinant for the pair’s future movements.
The USD/JPY pair is poised for a week packed with data-rich events. Given the weight of the US indicators, including employment and housing market insights, traders should anticipate potentially significant movements. On Japan’s end, the steady unemployment rate might offer a counterbalancing stability. As always, a keen eye on these events can present multiple trading opportunities for the discerning forex trader.
Comments