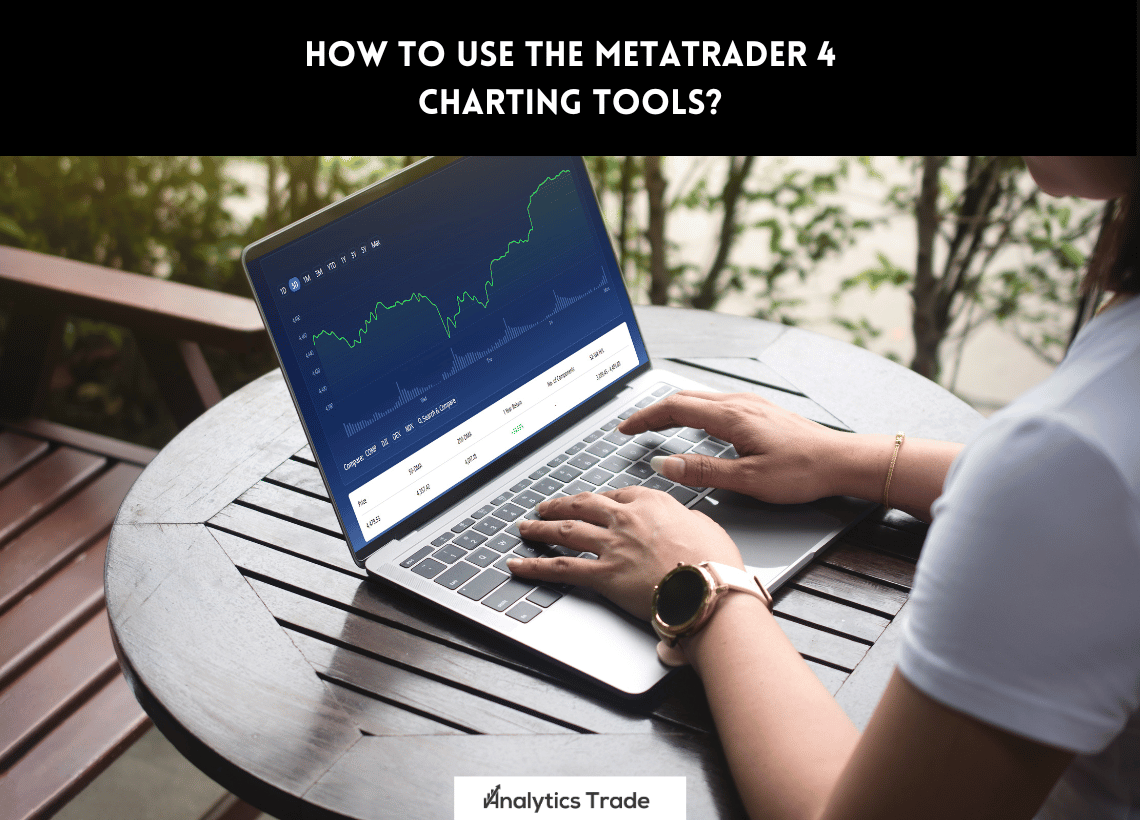
Introduction to MetaTrader 4 Charting Tools
The MetaTrader 4 (MT4) platform is one of the most popular trading platforms in the world. It is used by millions of traders to analyze the markets and make informed trading decisions. One of the key features of the MT4 platform is its charting tools. These tools allow traders to view the price action of a currency pair or other financial instrument in real-time. In this article, we will provide a comprehensive guide on how to use the MetaTrader 4 charting tools.
Basics of Charting
The first step in using the MetaTrader 4 charting tools is to understand the basics of charting. A chart is a graphical representation of the price action of a currency pair or other financial instrument. The chart is composed of two axes, the x-axis and the y-axis. The x-axis represents the time frame of the chart, while the y-axis represents the price of the currency pair or other financial instrument.The chart also contains a series of vertical lines, known as bars. Each bar represents the price action of the currency pair or other financial instrument over a specific period of time. For example, a one-minute chart will have a bar for each minute of trading. The bars are composed of four elements: the open, the high, the low, and the close. The open is the price at which the bar opened, the high is the highest price reached during the bar, the low is the lowest price reached during the bar, and the close is the price at which the bar closed.
Types of Charts
The MetaTrader 4 platform offers several types of charts, including line charts, bar charts, and candlestick charts. Line charts are the simplest type of chart and are composed of a series of connected points. Bar charts are composed of vertical lines that represent the open, high, low, and close of the currency pair or other financial instrument. Candlestick charts are composed of a series of candlesticks, which are composed of a body and two wicks. The body of the candlestick represents the open and close of the bar, while the wicks represent the high and low of the bar.
How to Customize the Charts
The MetaTrader 4 platform allows traders to customize the charts to suit their trading needs. Traders can customize the time frame of the chart, the type of chart, the color of the chart, and the indicators that are displayed on the chart.To customize the time frame of the chart, traders can select from a range of time frames, from one minute to one month. To customize the type of chart, traders can select from line charts, bar charts, and candlestick charts. To customize the color of the chart, traders can select from a range of colors, including black, white, red, green, and blue. To customize the indicators that are displayed on the chart, traders can select from a range of indicators, including moving averages, Bollinger Bands, and MACD.
How to Use the Charting Tools to Analyze the Market
Once the chart is customized, traders can use the charting tools to analyze the market. The charting tools allow traders to identify trends, support and resistance levels, and potential trading opportunities.
Identifying Trends
The charting tools can be used to identify trends in the market. A trend is a general direction in which the price of a currency pair or other financial instrument is moving. Trends can be identified by looking for patterns in the price action of the currency pair or other financial instrument. For example, if the price action is forming higher highs and higher lows, then the trend is likely to be an uptrend. Conversely, if the price action is forming lower highs and lower lows, then the trend is likely to be a downtrend.
Identifying Support and Resistance Levels
The charting tools can also be used to identify support and resistance levels. Support and resistance levels are price levels where the price of a currency pair or other financial instrument is likely to find support or resistance. Support levels are price levels where the price of a currency pair or other financial instrument is likely to find support and not fall below. Resistance levels are price levels where the price of a currency pair or other financial instrument is likely to find resistance and not rise above.
Identifying Trading Opportunities
The charting tools can also be used to identify potential trading opportunities. Traders can use the charting tools to identify patterns in the price action of the currency pair or other financial instrument. For example, traders can look for head and shoulders patterns, double tops and bottoms, and triangle patterns. Once a pattern is identified, traders can use the charting tools to determine the entry and exit points for the trade.
Conclusion
In conclusion, the MetaTrader 4 charting tools are a powerful tool for analyzing the markets. The charting tools allow traders to customize the charts to suit their trading needs, identify trends, support and resistance levels, and potential trading opportunities. By using the charting tools, traders can gain a better understanding of the markets and make informed trading decisions.
Additional Resources
- Wikipedia – MetaTrader 4
- metatrader-4-for-forex-trading/”target=”_blank” rel=”noopener” >metatrader+4+charting+tools” target=”_blank” rel=”noopener”>Youtube – How to Use MetaTrader 4 Charting Tools


Comments