
What are Harmonic Patterns?
Harmonic patterns are a type of technical analysis used to identify potential price reversals in the financial markets. They are based on the Fibonacci sequence and are used to identify potential support and resistance levels. Harmonic patterns are used by traders to identify potential trading opportunities and to help them make better trading decisions.
How to Use Harmonic Patterns with Trend Lines
Harmonic patterns can be used in conjunction with trend lines to identify potential trading opportunities. Trend lines are used to identify the direction of the trend and can be used to identify potential support and resistance levels. When used together, harmonic patterns and trend lines can provide traders with an edge in the markets.
Understanding the Basics of Harmonic Patterns
Harmonic patterns are based on the Fibonacci sequence and are used to identify potential support and resistance levels. The most commonly used harmonic patterns are the Gartley, Butterfly, Bat, and Crab patterns. Each of these patterns has its own set of rules and guidelines that must be followed in order for the pattern to be valid.
Gartley Pattern
The Gartley pattern is one of the most popular harmonic patterns and is used to identify potential reversals in the markets. The pattern is made up of five points and is based on the Fibonacci sequence. The pattern is considered valid when the price action retraces to the 0.618 Fibonacci level.
Butterfly Pattern
The Butterfly pattern is another popular harmonic pattern and is used to identify potential reversals in the markets. The pattern is made up of four points and is based on the Fibonacci sequence. The pattern is considered valid when the price action retraces to the 0.786 Fibonacci level.
Bat Pattern
The Bat pattern is another popular harmonic pattern and is used to identify potential reversals in the markets. The pattern is made up of three points and is based on the Fibonacci sequence. The pattern is considered valid when the price action retraces to the 0.886 Fibonacci level.
Crab Pattern
The Crab pattern is another popular harmonic pattern and is used to identify potential reversals in the markets. The pattern is made up of four points and is based on the Fibonacci sequence. The pattern is considered valid when the price action retraces to the 1.618 Fibonacci level.
Using Harmonic Patterns with Trend Lines
Harmonic patterns can be used in conjunction with trend lines to identify potential trading opportunities. Trend lines are used to identify the direction of the trend and can be used to identify potential support and resistance levels. When used together, harmonic patterns and trend lines can provide traders with an edge in the markets.
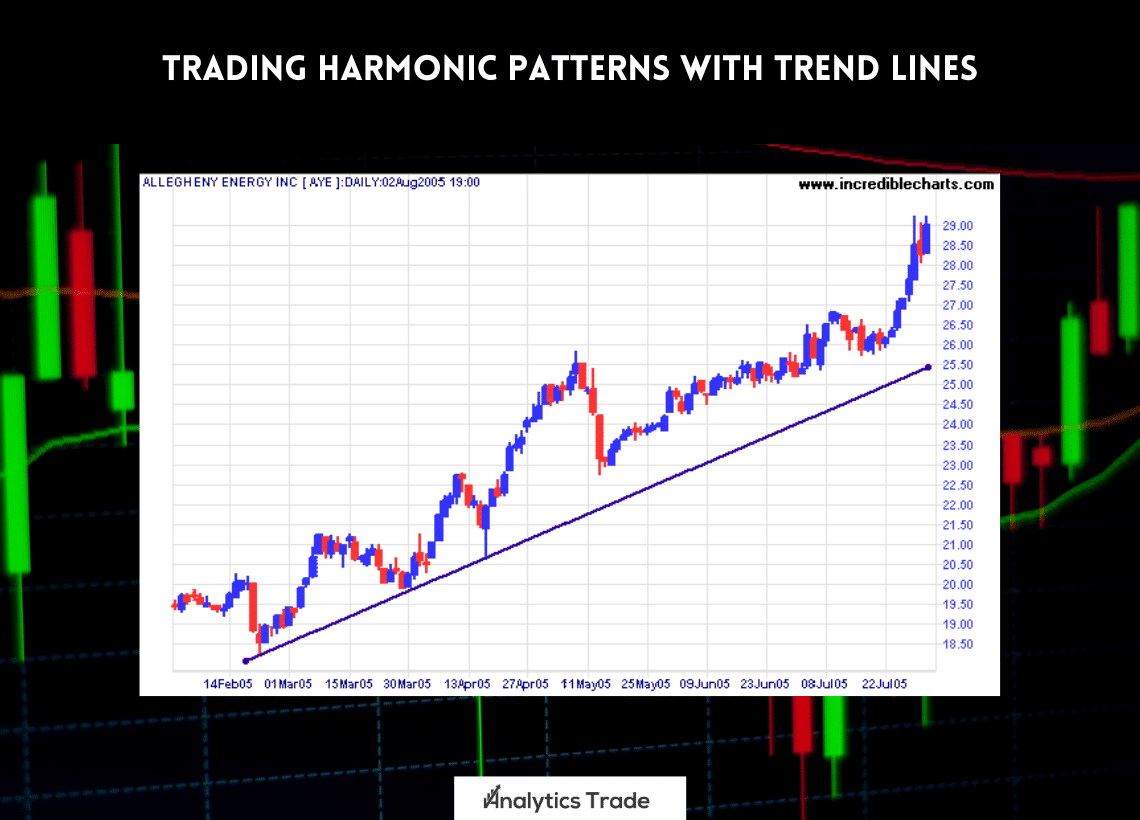
Identifying Trend Lines
The first step in using harmonic patterns with trend lines is to identify the trend lines. Trend lines are used to identify the direction of the trend and can be used to identify potential support and resistance levels. Trend lines can be identified by drawing a line connecting two or more points on the chart.
Identifying Harmonic Patterns
The next step in using harmonic patterns with trend lines is to identify the harmonic patterns. Harmonic patterns are used to identify potential reversals in the markets and can be used to identify potential trading opportunities. Harmonic patterns can be identified by looking for specific patterns on the chart.
Using Harmonic Patterns with Trend Lines
Once the trend lines and harmonic patterns have been identified, traders can use them together to identify potential trading opportunities. When used together, harmonic patterns and trend lines can provide traders with an edge in the markets.
Tips for Using Harmonic Patterns with Trend Lines
When using harmonic patterns with trend lines, it is important to remember a few key tips. First, it is important to remember that harmonic patterns are not always reliable and should be used in conjunction with other forms of analysis. Second, it is important to remember that trend lines can be used to identify potential support and resistance levels. Finally, it is important to remember that harmonic patterns can be used to identify potential trading opportunities.
Conclusion
Trading harmonic patterns with trend lines can be a powerful tool for traders. By understanding the basics of harmonic patterns and how to use them with trend lines, traders can increase their chances of success in the markets. To learn more about trading harmonic patterns with trend lines, check out this video tutorial.
Summary
Harmonic patterns are a type of technical analysis used to identify potential price reversals in the financial markets. They are based on the Fibonacci sequence and are used to identify potential support and resistance levels. Harmonic patterns can be used in conjunction with trend lines to identify potential trading opportunities. Trend lines are used to identify the direction of the trend and can be used to identify potential support and resistance levels. When used together, harmonic patterns and trend lines can provide traders with an edge in the markets.


Comments