
What are Harmonic Patterns?
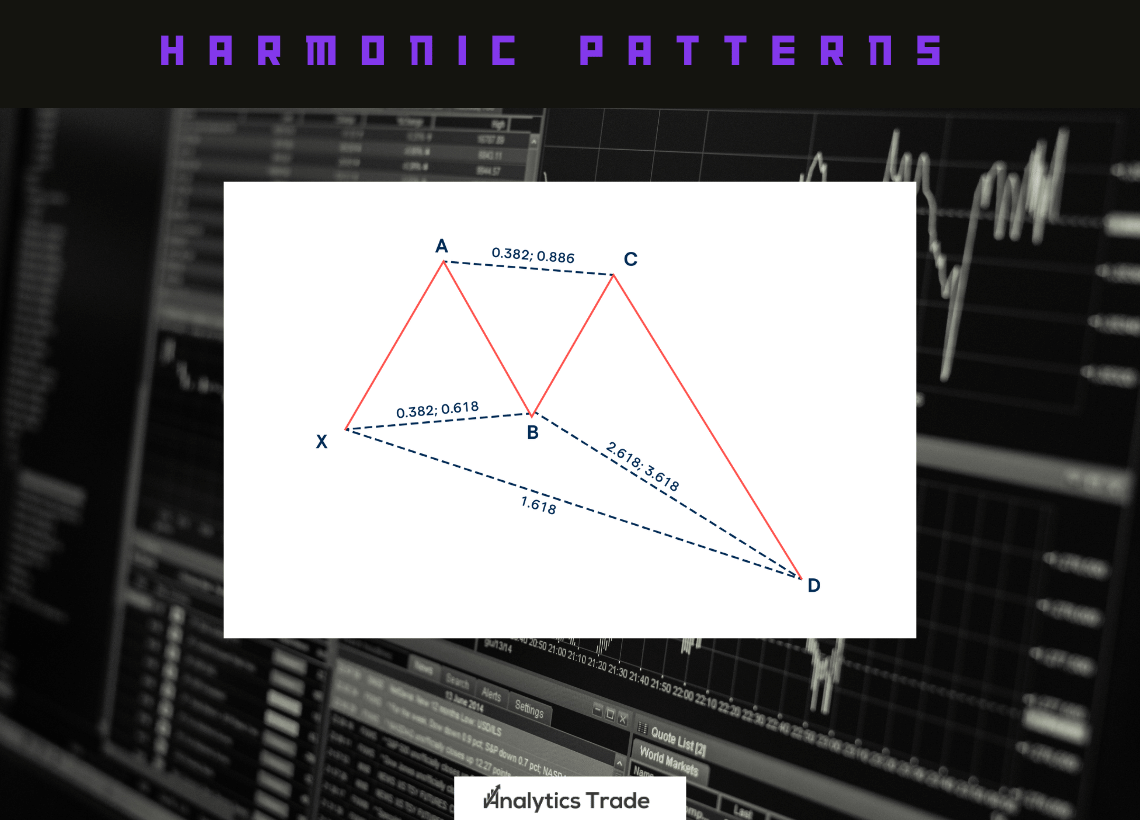
Harmonic patterns are a type of technical analysis used to identify potential price reversals in the financial markets. They are based on Fibonacci numbers and ratios, and are used to identify potential support and resistance levels. Harmonic patterns are used by traders to identify potential entry and exit points in the market.
How to Trade Harmonic Patterns with Support and Resistance?
Trading harmonic patterns with support and resistance can be a powerful tool for traders. By combining the two, traders can identify potential entry and exit points in the forex market.The first step in trading harmonic patterns with support and resistance is to identify the pattern. There are several different types of harmonic patterns, including Gartley, Butterfly, Bat, and Crab. Each trading pattern has its own unique characteristics and can be used to identify potential support and resistance levels. Once the pattern has been identified, traders can then use support and resistance levels to determine potential entry and exit points. Support and resistance levels are areas in the market where price is likely to find support or resistance. By combining the two, traders can identify potential entry and exit points in the market.
Identifying Support and Resistance Levels
Support and resistance levels can be identified by looking at price action. Support levels are areas in the market where price is likely to find support, while resistance levels are areas in the market where price is likely to find resistance. Support and resistance levels can also be identified by looking at chart patterns. Chart patterns such as double tops, double bottoms, and head and shoulders can be used to identify potential support and resistance levels.
Using Support and Resistance Levels
Once support and resistance levels have been identified, traders can then use them to determine potential entry and exit points. Support levels can be used to identify potential entry points, while resistance levels can be used to identify potential exit points. Traders can also use support and resistance levels to determine potential stop loss and take profit levels. Stop loss levels can be placed below support levels, while take profit levels can be placed above resistance levels.
Using Harmonic Patterns with Support and Resistance
Once support and resistance levels have been identified, traders can then use harmonic patterns to identify potential entry and exit points. Harmonic patterns can be used to identify potential reversals in the market, and can be used to identify potential entry and exit points. Traders can also use harmonic patterns to determine potential stop loss and take profit levels. Stop loss levels can be placed below support levels, while take profit levels can be placed above resistance levels.
Comparison Differences: Trading Harmonic Patterns with Support and Resistance
| Harmonic Patterns | Support and Resistance |
|---|---|
| Based on Fibonacci ratios and geometric patterns | Based on historical price levels where price has shown a reaction |
| Provides precise entry, stop loss, and target levels | Provides potential entry zones and areas to place stop loss orders, but not exact levels |
| Requires extensive knowledge of Fibonacci ratios and pattern recognition | Relatively simple to learn and apply, even for beginners |
| Works best in trending markets | Effective in both trending and ranging markets |
| May require specialized software or tools for pattern identification | Can be identified using basic charting tools or by visual analysis |
| Offers high probability trade setups when identified correctly | Offers trade setups with varying probabilities, depending on the strength of the support or resistance level |
Personal Opinion
Trading harmonic patterns with support and resistance can be a powerful trading tool for traders. By combining the two, traders can identify potential entry and exit points in the market. Support and resistance levels can be used to identify potential stop loss and take profit levels, while harmonic patterns can be used to identify potential reversals in the market. With the right combination of support and resistance levels and harmonic patterns, traders can increase their chances of success in the markets.


Comments