

Timeframe: 5-minute
Recommend pair: Any major pair
Indicator: Parabolic SAR
Platform: MT4, TradingView
Long trade setup
Entry
The price should move above the SAR dots. Wait for the price action to continue moving upwards and enter the trade.
Take-profit
Set TP when the price moves below the dots.
Stop-loss
Place a stop-loss at the recent low from the entry point.
Example:
The price goes above the SAR dots in the chart below, presenting a potential long entry point.
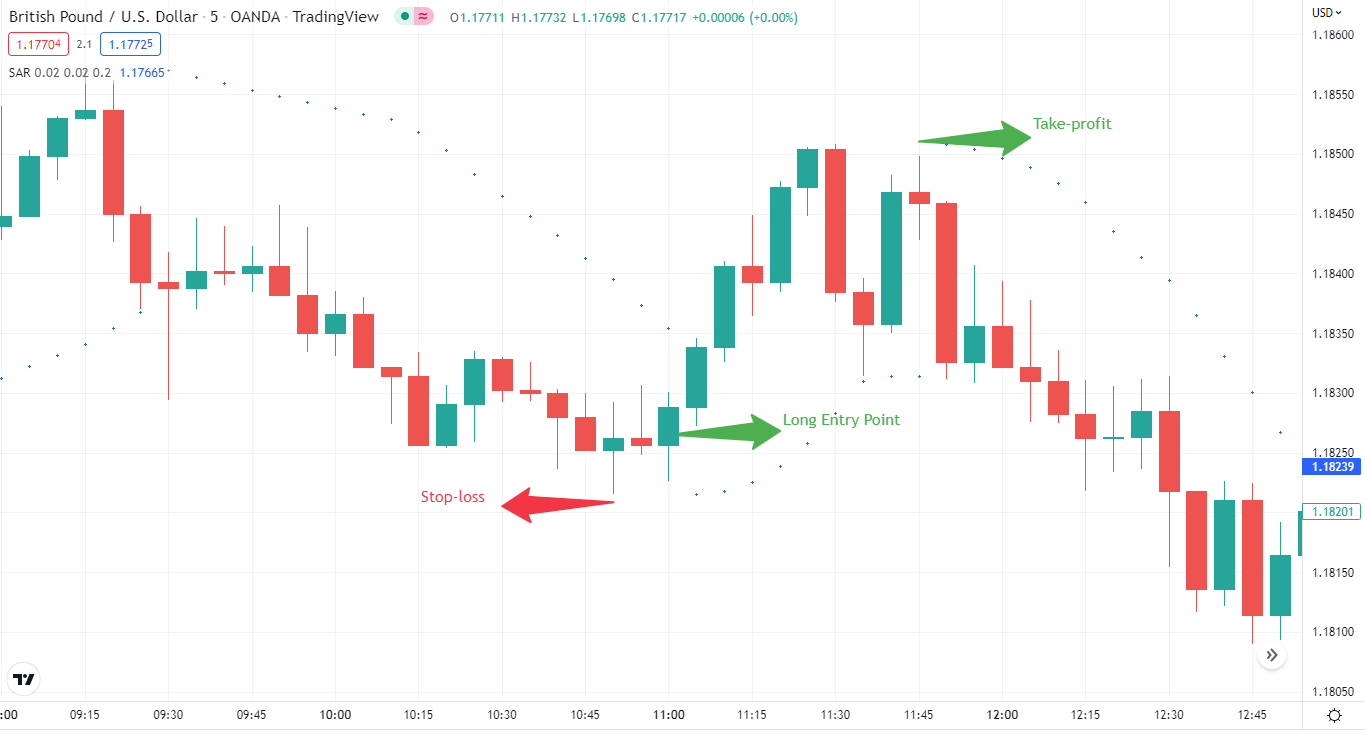
Long trade setup
Short trade setup
Entry
The price should move below the SAR dots. Wait for the price action to continue moving downwards and enter the trade.
Take-profit
Set TP when the price moves above the dots.
Stop-loss
Place a stop-loss at the recent high from the entry point.
Example:
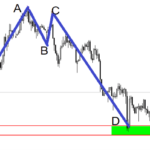
The price goes below the SAR dots in the chart below, presenting a potential short entry point.
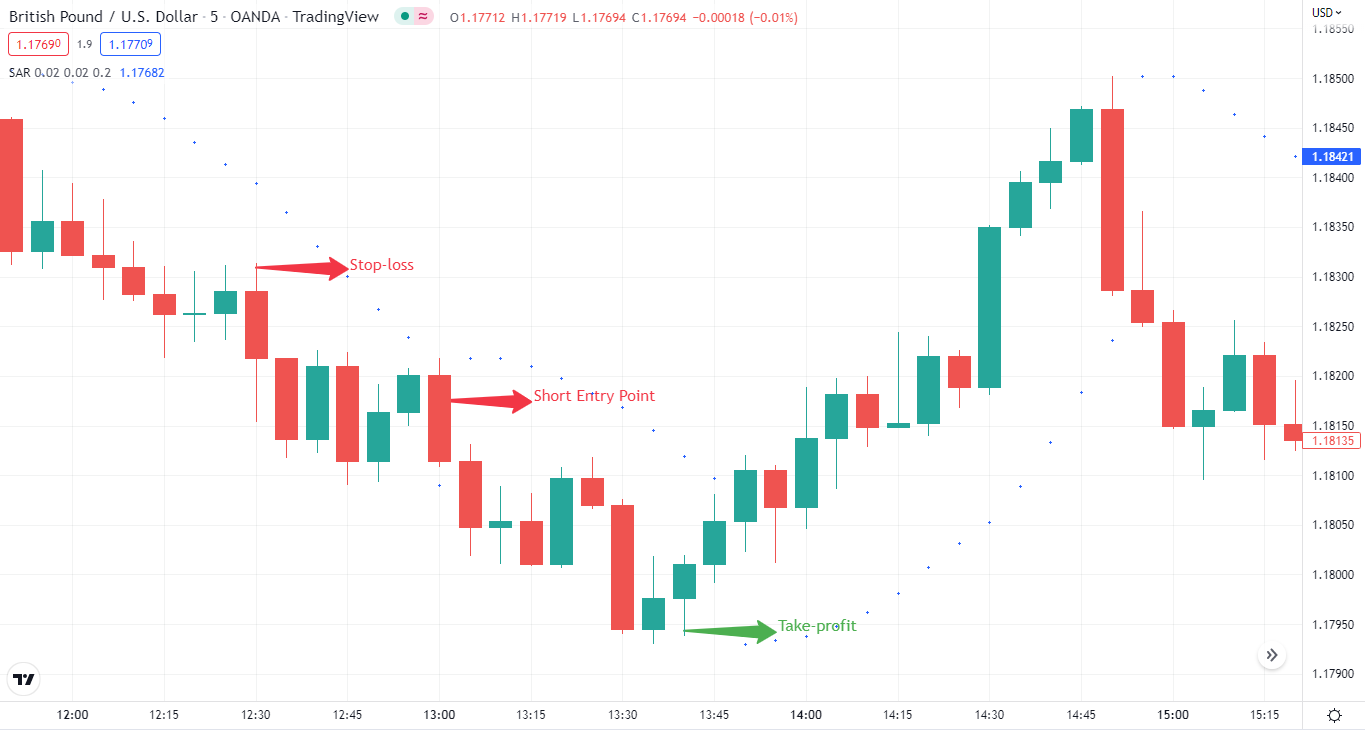
Short trade setup


Comments