
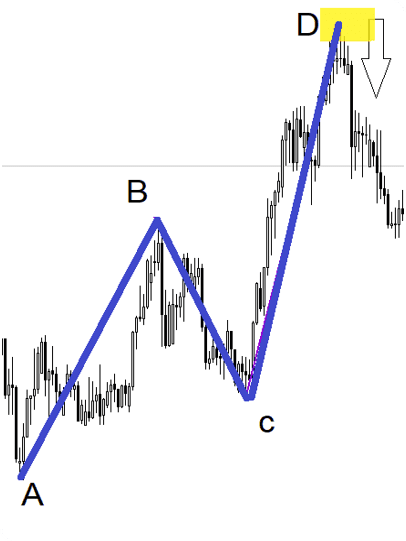
How to measure the ABCD harmonic pattern?
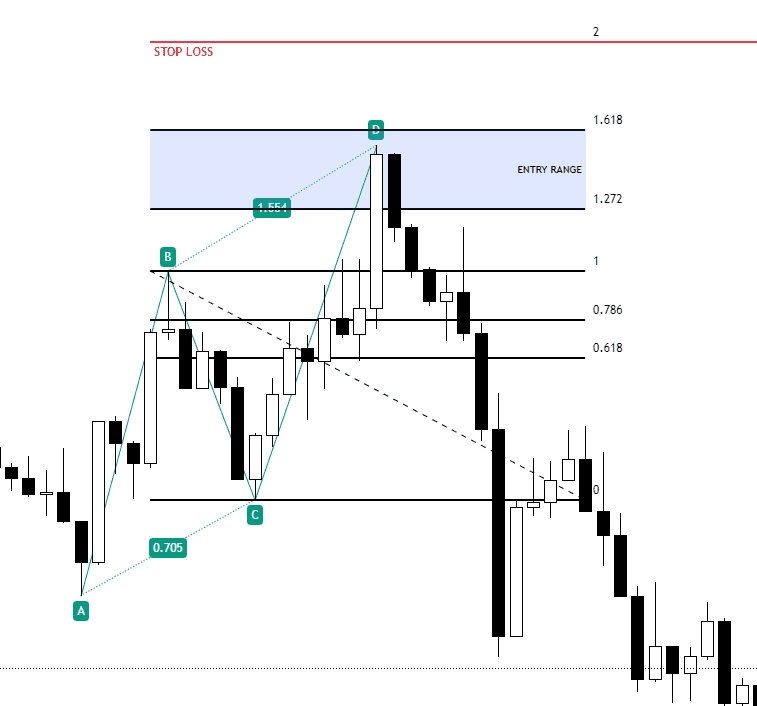
Stage 1 – Formation of BC leg, you must first identify an impulse leg (AB leg) to measure a retracement from and the extent of such retracement leg (BC leg) must only fall within 0.618 to 0.786 Fibonacci retracement
Stage 2 – Formation of CD leg, once a 0.618 to 0.786 Fibonacci retracement is met, price now must react all the way to 1.272% to 1.618% Fibonacci extension measuring the BC leg to successfully form the ABCD pattern.
| ABCD | |
| AB | Any impulse leg |
| C | 0.618; 0.786 AB |
| D | 1.272; 1.618 BC |
| Stop loss | 2.000 BC |
| Take profit | 0.382; 0.618 AD |
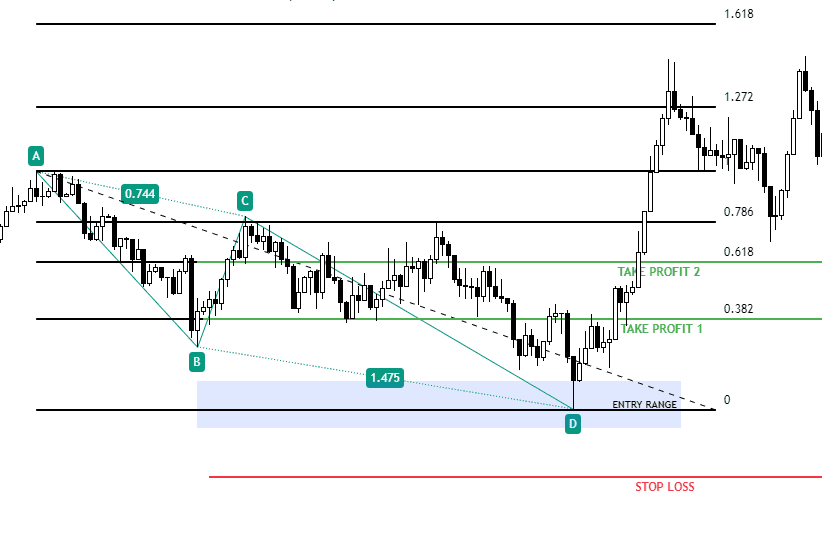
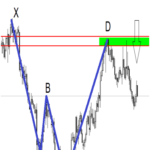
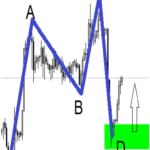
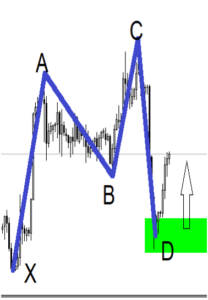
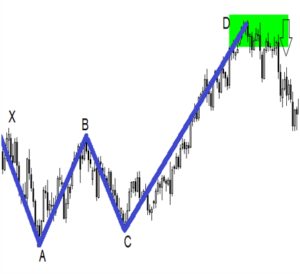
Long Trade example
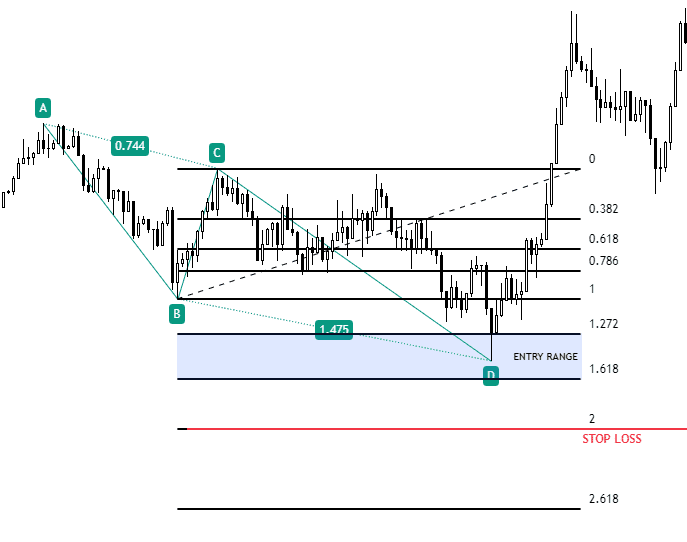
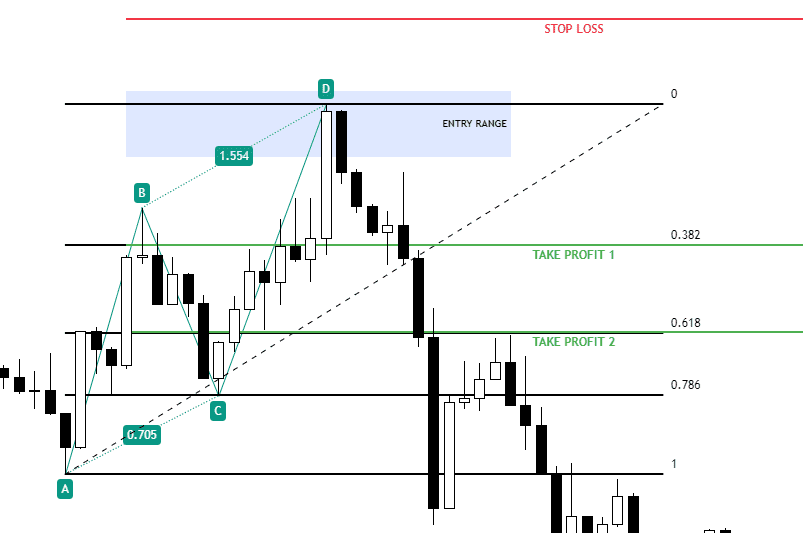
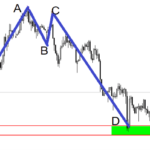
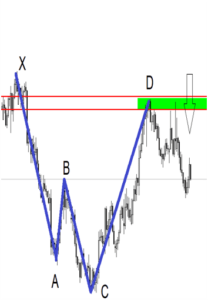
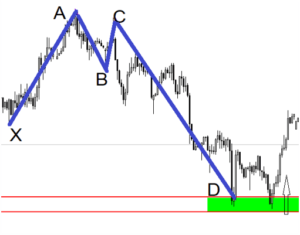
Short Trade example

Comments