
What is a Forex Heat Map?
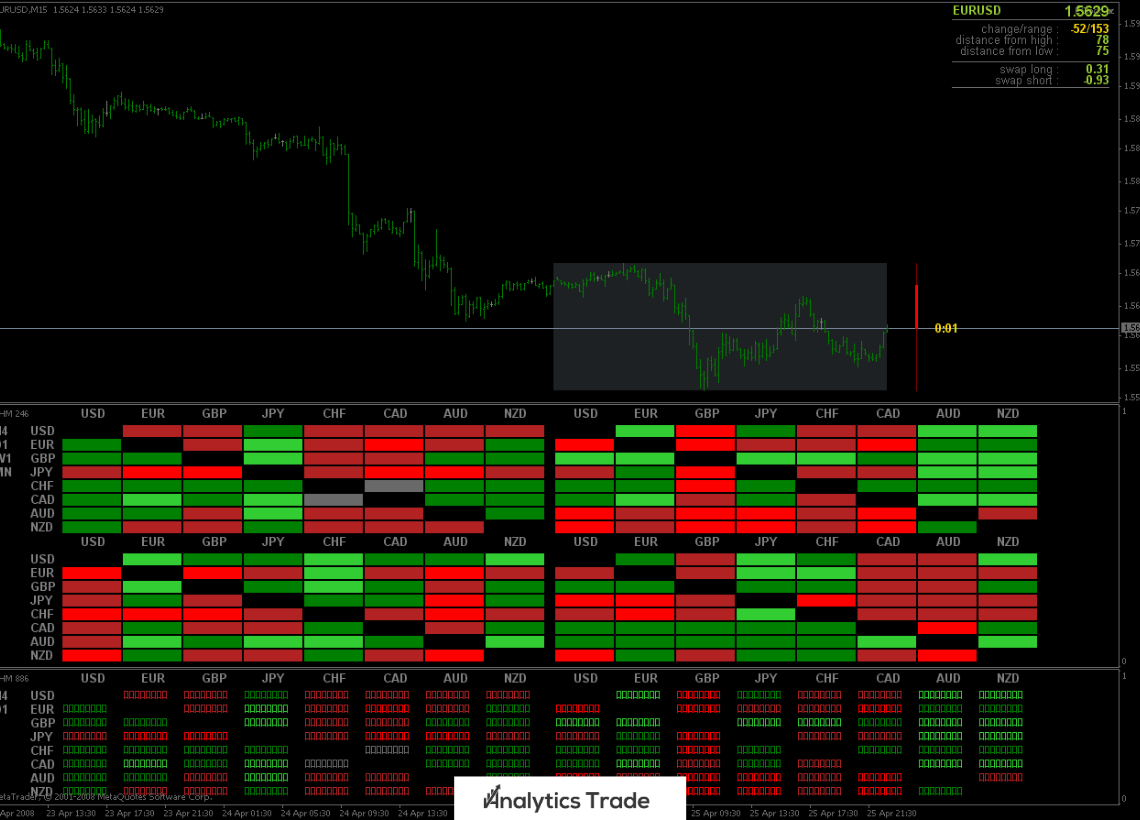
A Forex heat map is a tool used by traders to quickly understand the direction of the market. It is a visual representation of the currency pairs and their relative strength or weakness. The heat map is typically color-coded, with red representing strong currencies and green representing weak currencies. The heat map can be used to identify trading opportunities and make better trading decisions.
How to Use a Forex Heat Map
Using a Forex heat map is relatively straightforward. The first step is to identify the currency pairs that are currently in play. This can be done by looking at the currency pairs that are being traded on the market. Once the currency pairs have been identified, the trader can then use the heat map to determine which currency pairs are strong and which are weak.The heat map will typically show the relative strength or weakness of each currency pair. For example, if a currency pair is showing a strong red color, it means that the currency pair is strong. Conversely, if a currency pair is showing a weak green color, it means that the currency pair is weak.Once the trader has identified the currency pairs that are strong or weak, they can then use this information to make trading decisions. For example, if a currency pair is showing a strong red color, the trader may decide to buy the currency pair. Conversely, if a currency pair is showing a weak green color, the trader may decide to sell the currency pair.
Benefits of Using a Forex Heat Map
Using a Forex heat map can be beneficial for traders in several ways. First, it can help traders quickly identify trading opportunities. By looking at the heat map, traders can quickly identify which currency pairs are strong and which are weak. This can help traders make better trading decisions and take advantage of trading opportunities.Second, a Forex heat map can help traders identify trends in the market. By looking at the heat map, traders can quickly identify which currency pairs are trending in which direction. This can help traders identify potential trading opportunities and make better trading decisions.Finally, a Forex heat map can help traders identify support and resistance levels. By looking at the heat map, traders can quickly identify which currency pairs are showing strong support or resistance levels. This can help traders identify potential trading opportunities and make better trading decisions.
Using a Forex Heat Map to Identify Trading Opportunities
Using a Forex heat map can be a great way to identify trading opportunities. By looking at the heat map, traders can quickly identify which currency pairs are strong and which are weak. This can help traders make better trading decisions and take advantage of trading opportunities.
Using a Forex Heat Map to Identify Trends
Using a Forex heat map can also be a great way to identify trends in the market. By looking at the heat map, traders can quickly identify which currency pairs are trending in which direction. This can help traders identify potential trading opportunities and make better trading decisions.
Using a Forex Heat Map to Identify Support and Resistance Levels
Finally, a Forex heat map can be a great way to identify support and resistance levels. By looking at the heat map, traders can quickly identify which currency pairs are showing strong support or resistance levels. This can help traders identify potential trading opportunities and make better trading decisions.
Conclusion
A Forex heat map is a powerful tool that can be used by traders to quickly identify trading opportunities and make better trading decisions. By looking at the heat map, traders can quickly identify which currency pairs are strong and which are weak. They can also use the heat map to identify trends in the market and identify support and resistance levels. Using a Forex heat map can be a great way to identify trading opportunities and make better trading decisions. However, it is important to remember that the heat map is just one tool in a trader’s toolbox. It is important to combine the heat map with other analysis techniques in order to make the most informed trading decisions.For more information about Forex heat maps, traders can visit Wikipedia.org to learn more.
Personal Opinion
As a trader, I find Forex heat maps to be a valuable tool in my trading arsenal. They provide me with a quick and easy way to identify trading opportunities and make better trading decisions. I also find them to be a great way to identify trends in the market and identify support and resistance levels. I highly recommend that all traders use Forex heat maps as part of their trading strategy.


Comments