
Oscillators are important indicators that help tell the state or position of a financial asset. These are used to help traders make successful decisions when finalizing a trade.
In this article, we will look into some of the best trading oscillators that you can use in trading.
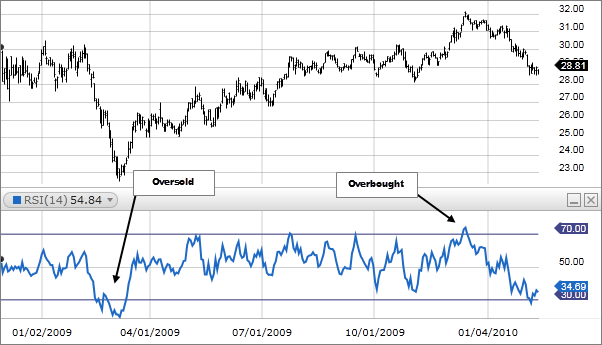
1. Relative strength index (RSI)
It is one of the most popular oscillators developed by J. Welles Wilder. RSI is known to measure the speed and change of price movements in the financial market. You can calculate it by first finding the relative strength of an asset and then adding one to it.
After that, you divide the result by a hundred and subtract the final figure by 100. RSI can be used in several ways to identify overbought and oversold levels.
The overbought baseline level is 70, while the oversold level is 30. RSI can also be used in trend following, meaning that the asset price will keep rising if the RSI is on an upward trend.
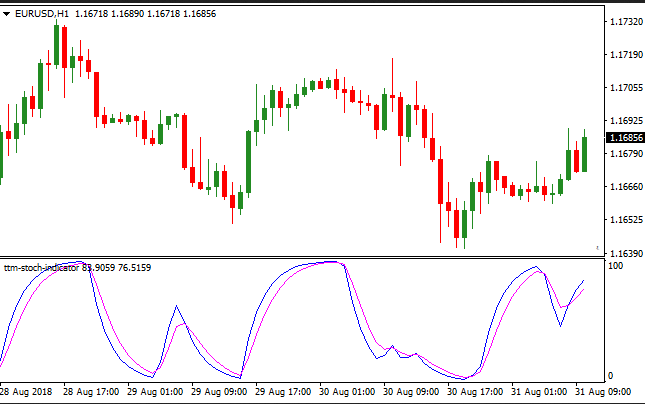
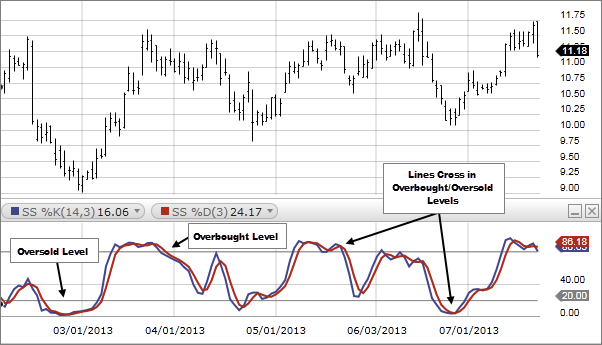
2. Stochastics
Stochastics is a popular oscillator for trading developed by George Lane. its main job is to show the location of the close relative to the high-low range over a certain period. The indicator has two flowing lines known as %K and %D. It also has overbought and oversold levels at 80 and 20, respectively.
Traders make most of the oscillator when a financial asset is trending or when there is some volatility. Along with that, It is not easy to be used in ranging markets. This indicator can be used to buy when it gets extremely oversold and then sell when it gets extremely overbought.
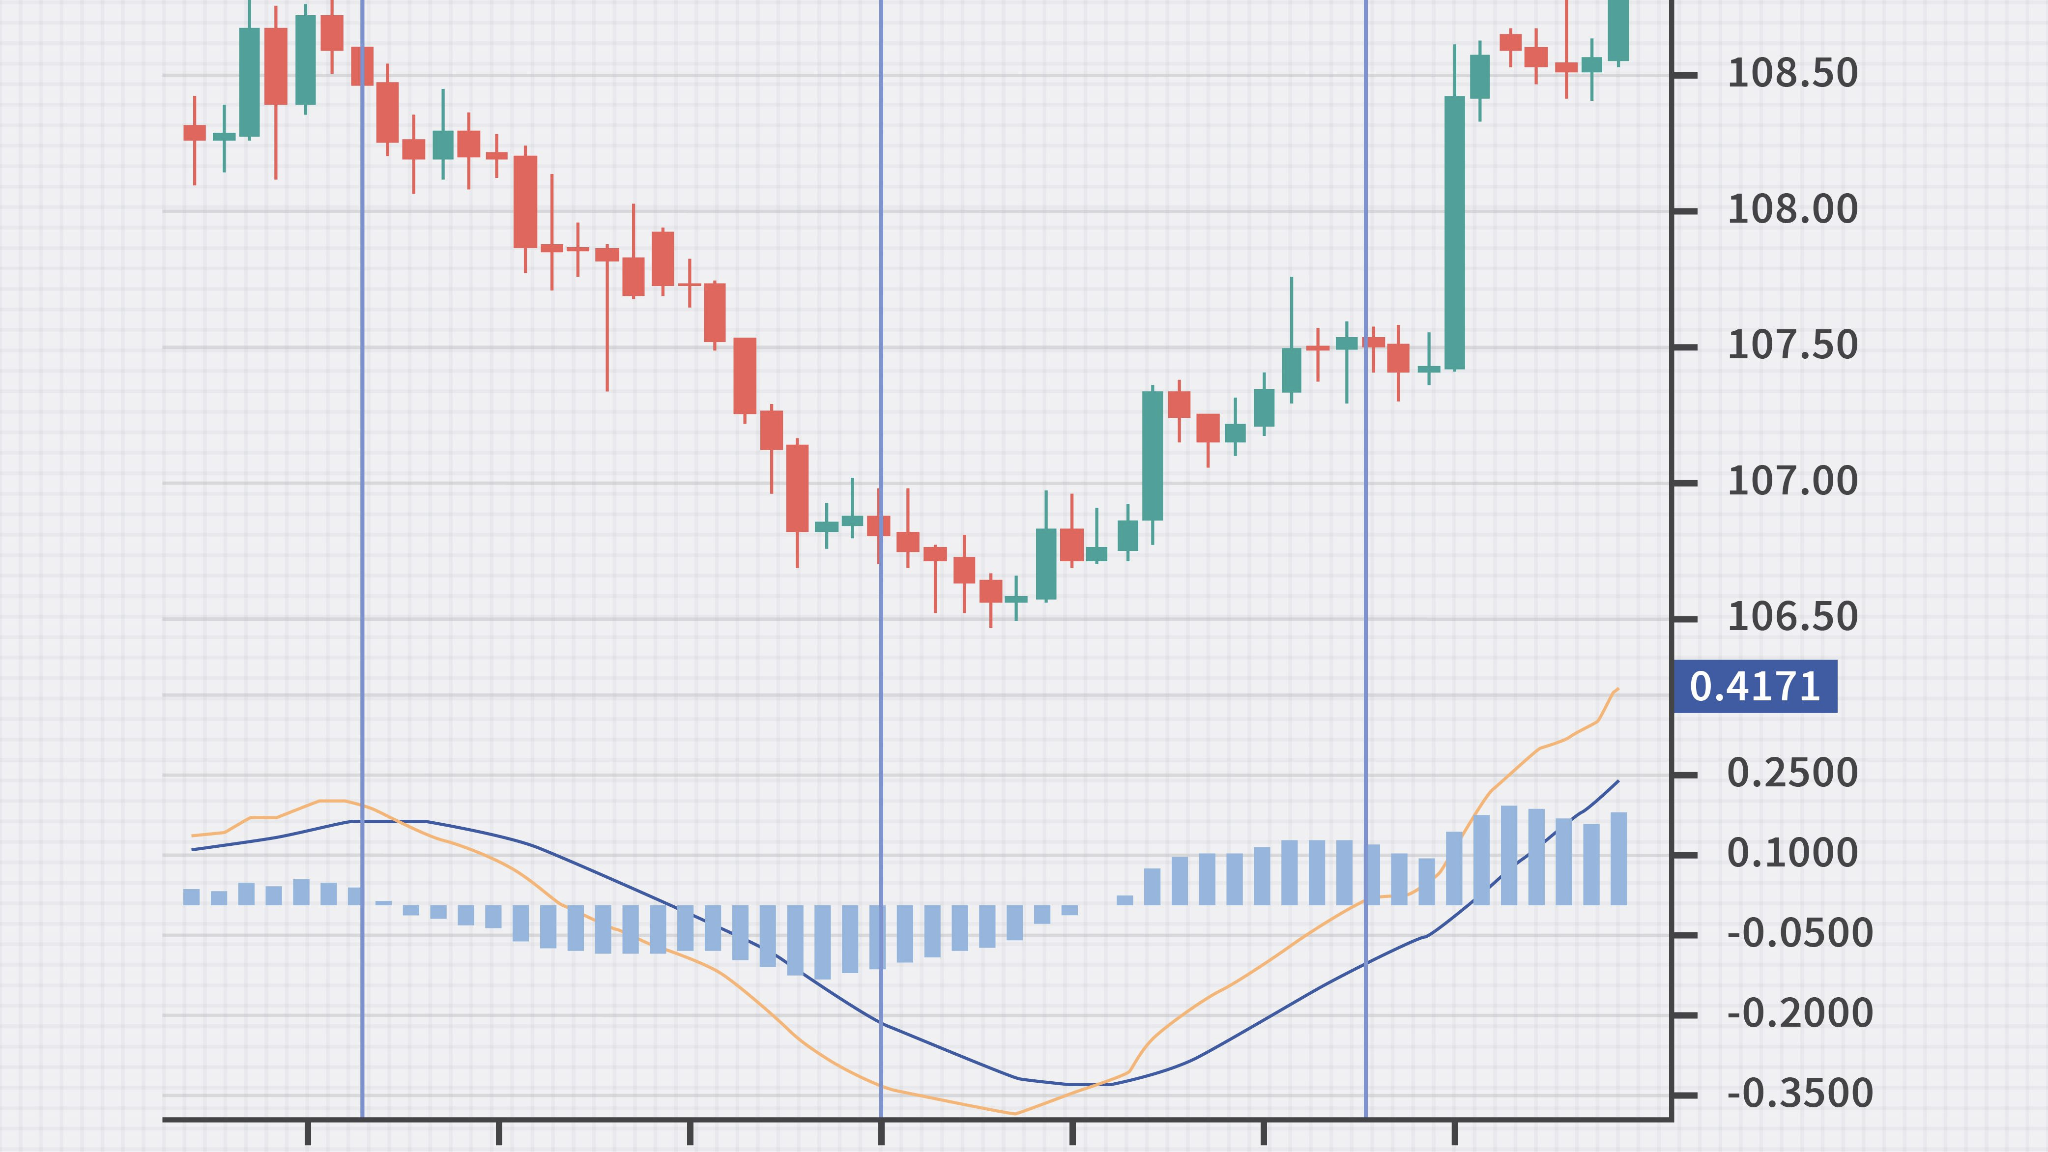
3. Moving Average Convergence Divergence (MACD)
MACD is heavily used in trading as it gives traders a lot of information. This includes showing changes in the direction, momentum, duration, and strength of a particular trend.
However, it is still an excellent indicator most commonly used by traders. It consists of three parts; two lines of moving averages and one histogram.
MACD is a fairly complex indicator that seems simple, but once you know how it works, it shows a lot of information. The concept works by using and selling positions to enter or exit a trade.
A zero line determines what position to take with the help of the other two lines. When the MACD line crosses above the zero line, the trader should choose to buy in this case. If the MACD line crosses below the zero line, the optimal move would be to sell.
Final thoughts
All technical indicators and oscillators are useful for traders, some giving more information than others. Traders must be careful when using oscillators, as trends can change instantaneously. It is best to combine different indicators instead of relying on one.


Comments