

What are Harmonic Patterns?
Harmonic patterns are a type of chart pattern used in technical analysis to identify potential price reversals. They are based on Fibonacci numbers and ratios, and are used to identify potential support and resistance levels. Harmonic patterns are used by traders to identify potential entry and exit points in the market.
Types of Harmonic Patterns
There are several different types of harmonic patterns, each with its own unique characteristics. The most common harmonic patterns are the Gartley, Butterfly, Bat, Crab, and Shark patterns. Each of these chart patterns has its own unique characteristics and can be used to identify potential price reversals.
Identifying Harmonic Patterns
Identifying harmonic patterns can be a difficult task, as they require a certain level of skill and experience. Traders must be able to identify the patterns in the chart and then use the Fibonacci ratios to confirm the pattern. Once the pattern is confirmed, traders can then use the pattern to identify potential entry and exit points in the market.
Gartley Pattern
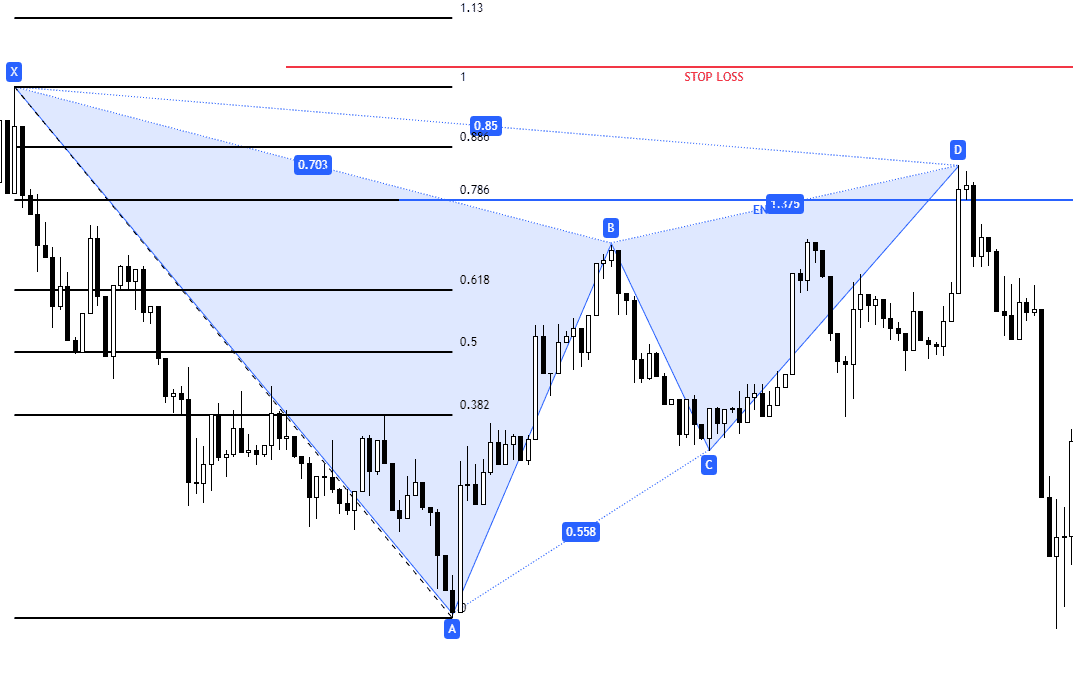
The Gartley pattern is one of the most popular harmonic patterns. It is characterized by a series of five points, which form an “M” shape. The points are labeled X, A, B, C, and D. The pattern is confirmed when the price action retraces to the 0.618 Fibonacci level.
Butterfly Pattern
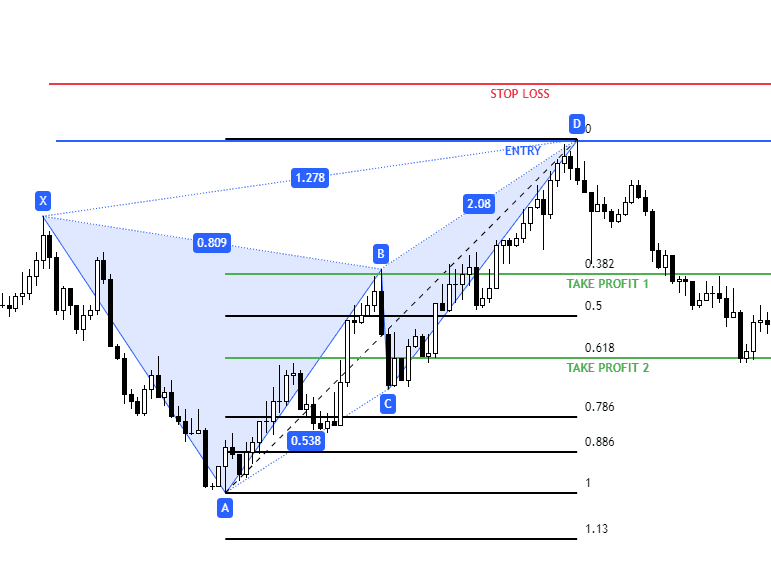
The Butterfly pattern is another popular harmonic pattern. It is characterized by a series of four points, which form a “W” shape. The points are labeled X, A, B, and C. The pattern is confirmed when the price action retraces to the 0.786 Fibonacci level.
Using Moving Averages with Harmonic Patterns
Moving averages are a popular technical indicator used by traders to identify potential entry and exit points in the market. They can be used in conjunction with harmonic patterns to identify potential price reversals. When used together, harmonic patterns and moving averages can help traders identify potential entry and exit points in the market.
Table of Harmonic Patterns and Moving Averages
| Harmonic Pattern | Moving Average |
|---|---|
| Gartley | 20-period simple moving average |
| Butterfly | 50-period simple moving average |
| Bat | 100-period simple moving average |
| Crab | 200-period simple moving average |
| Shark | 400-period simple moving average |
Conclusion
Trading harmonic patterns with moving averages can be a powerful tool for traders. By combining the two, traders can identify potential entry and exit points in the market. However, it is important to remember that no trading strategy is foolproof and that traders should always use risk management techniques to protect their capital.


Comments