
What is the Williams Percent Range (Williams %R)?
The Williams Percent Range (Williams %R) is a momentum indicator that measures overbought and oversold levels in the market. It was developed by Larry Williams and is similar to the Stochastic Oscillator. The Williams %R is a momentum indicator that measures the level of the close relative to the highest high for the look-back period.
How to Use the Williams %R Indicator
The Williams %R indicator is used to identify overbought and oversold levels in the market. It is also used to identify potential reversals in the market. The indicator is calculated by subtracting the highest high for the look-back period from the current closing price and then dividing the result by the highest high for the look-back period.
Overbought and Oversold Levels
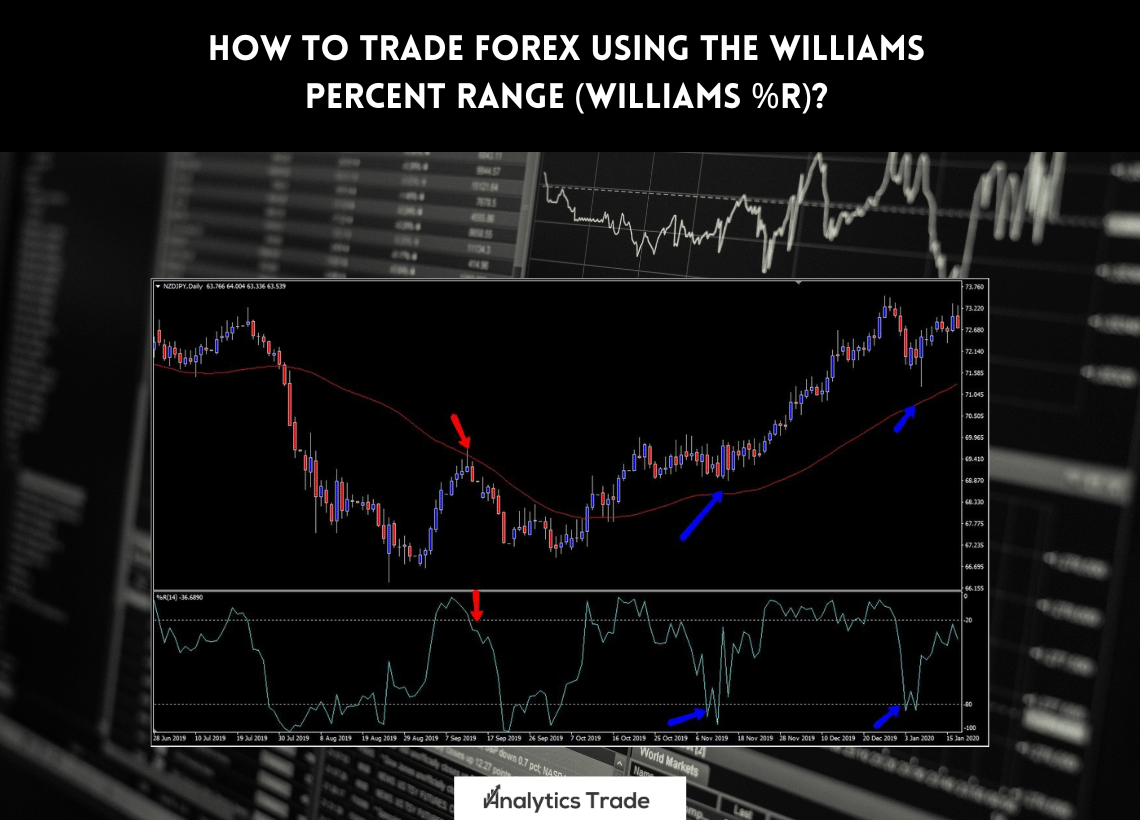
When the Williams %R is above -20, it is considered to be overbought. When the Williams %R is below -80, it is considered to be oversold. These levels can be used to identify potential reversals in the market.
Trading with the Williams %R Indicator
When the Williams %R is above -20, traders should look for opportunities to sell. When the Williams %R is below -80, traders should look for opportunities to buy. Traders should also look for potential reversals in the market when the Williams %R is near these levels.
Conclusion
The Williams Percent Range (Williams %R) is a momentum indicator that measures overbought and oversold levels in the market. It is used to identify potential reversals in the market and can be used to generate trading signals. Traders should look for opportunities to buy when the Williams %R is below -80 and look for opportunities to sell when the Williams %R is above -20.
Summary
The Williams Percent Range (Williams %R) is a momentum indicator that can be used to identify overbought and oversold levels in the market. It is also used to identify potential reversals in the market. Traders should look for opportunities to buy when the Williams %R is below -80 and look for opportunities to sell when the Williams %R is above -20. To learn more about the Williams %R indicator, watch this video on YouTube.


Comments